
Logs export is live
Initially, we thought we could reuse the exact same pipeline we use for metrics: the OpenTelemetry (OTel) Collector discovering Kubernetes pods by labels and scraping their logs. But we quickly discovered that this isn’t currently possible: the OTel Collector doesn’t support scraping logs from Kubernetes pods filtered by labels.
We then faced another challenge: NeonVM runs multiple processes, but we only wanted to export Postgres logs to start with. Since we don’t use structured logging, filtering the logs accurately is difficult and prone to errors.
These factors combined led us to rethink our approach. In the end, we chose a proven solution: using rsyslogd. Instead of scraping logs, we decided to push them to the collector.
Here’s what our current architecture looks like when exporting Postgres logs to third-party observability platforms:
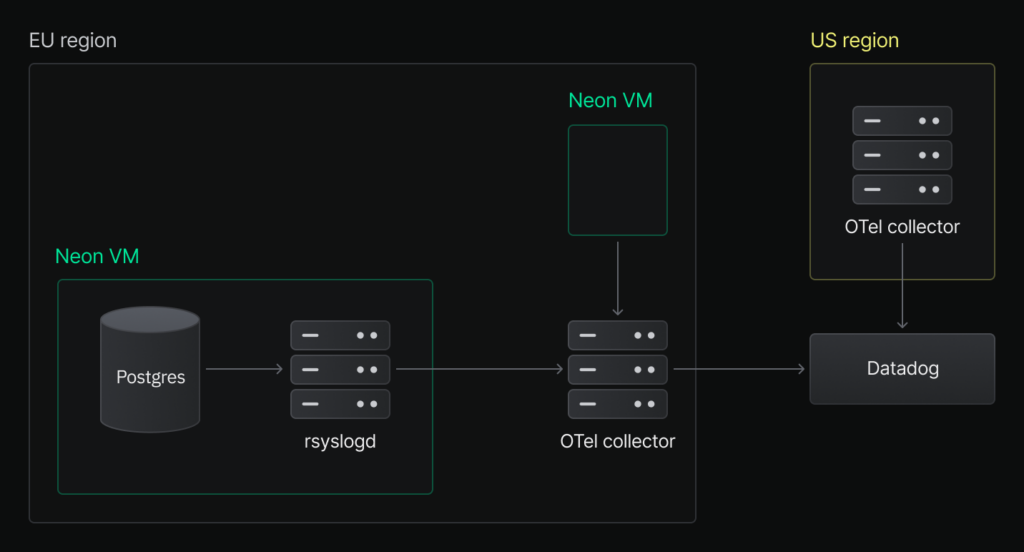
When a customer enables log export, we configure Postgres to send logs to rsyslogd in addition to writing them to stderr. The stderr output is still used internally, while rsyslogd is responsible for forwarding logs to the appropriate OpenTelemetry Collector. From there, logs are enriched and sent to the user’s observability platform of choice.
Once rsyslogd is in place, it takes care of forwarding logs to the OTel Collector. Postgres logs are sent using the TCP syslog protocol in a structured format compatible with the collector’s receiver.
Here’s a sample rsyslogd configuration used to forward Postgres logs:
if $programname == 'postgres' then {{
    action(type="omfwd" target="{hostname}" port="10514" protocol="tcp"
           template="RSYSLOG_SyslogProtocol23Format")
    stop
}}
This rule filters only for Postgres logs and pushes them to the designated OTel Collector endpoint over TCP, using the RFC 5424 format.
The OTel Collector then receives, enriches, and exports the logs. Below is a sample configuration that shows how logs are received from rsyslogd, matched to the correct Kubernetes pods, and forwarded to Datadog:
receivers:
  syslog:
    protocol: rfc5424
    tcp:
      add_attributes: true
      listen_address: 0.0.0.0:10514

exporters:
  datadog:
    api:
      fail_on_invalid_key: true
      key: ${env:DATADOG_API_KEY}
      site: ${env:DATADOG_SITE}
    host_metadata:
      enabled: false

processors:
  transform/match_pod:
    log_statements:
    - context: log
      statements:
      - set(resource.attributes["k8s.pod.ip"], attributes["net.peer.ip"])
      - delete_matching_keys(attributes, "^net\\..+")

  k8sattributes:
    auth_type: serviceAccount
    filter:
      labels:
      - key: neon/project-id
        op: equals
        value: ${env:NEON_PROJECT_ID}
      namespace: default
    pod_association:
    - sources:
      - from: resource_attribute
        name: k8s.pod.ip
    extract:
      labels:
      - from: pod
        key: neon/project-id
        tag_name: project_id
      metadata:
      - k8s.pod.name

service:
  pipelines:
    logs/datadog:
      receivers: [syslog]
      processors: [memory_limiter, transform/match_pod, k8sattributes]
      exporters: [datadog]
This config does several key things:
- Accepts TCP syslog messages from
rsyslogd - Uses the
net.peer.ipto match logs to the correct pod - Extracts Kubernetes labels to enrich the logs with project-specific metadata
- Forwards the enriched logs to Datadog
As always, implementation details introduced some surprises. Here are a few of the challenges we had to work through while building log export.
When a user enables or disables log export, we want to update the compute instance on the fly. That works fine for Postgres: its configuration can be reloaded without restarting the process.
But rsyslogd doesn’t support dynamic config reloads. To apply changes, we have to restart the rsyslogd process itself, which adds a bit of operational friction we had to account for.
Logs received by the OTel Collector need to be enriched with metadata, specifically, project- and endpoint-specific labels, so they can be routed and visualized correctly in the user’s observability platform.
We use the k8sattributes processor to do this. It matches pods based on the source IP of the incoming TCP connection from rsyslogd. But this didn’t work out of the box: we ran into a known bug that prevented correct pod matching via net.peer.ip.
To work around this, we added a transform processor step to copy the net.peer.ip attribute into the expected k8s.pod.ip format and clean up other network attributes.
One side benefit of introducing rsyslogd was improved support for compliance use cases. For HIPAA customers, we need to persist Postgres logs in secure storage. Conveniently, we can reuse the same rsyslogd instance. It already reads from pg_audit and now also forwards those logs to secure, long-term storage in addition to exporting them externally.
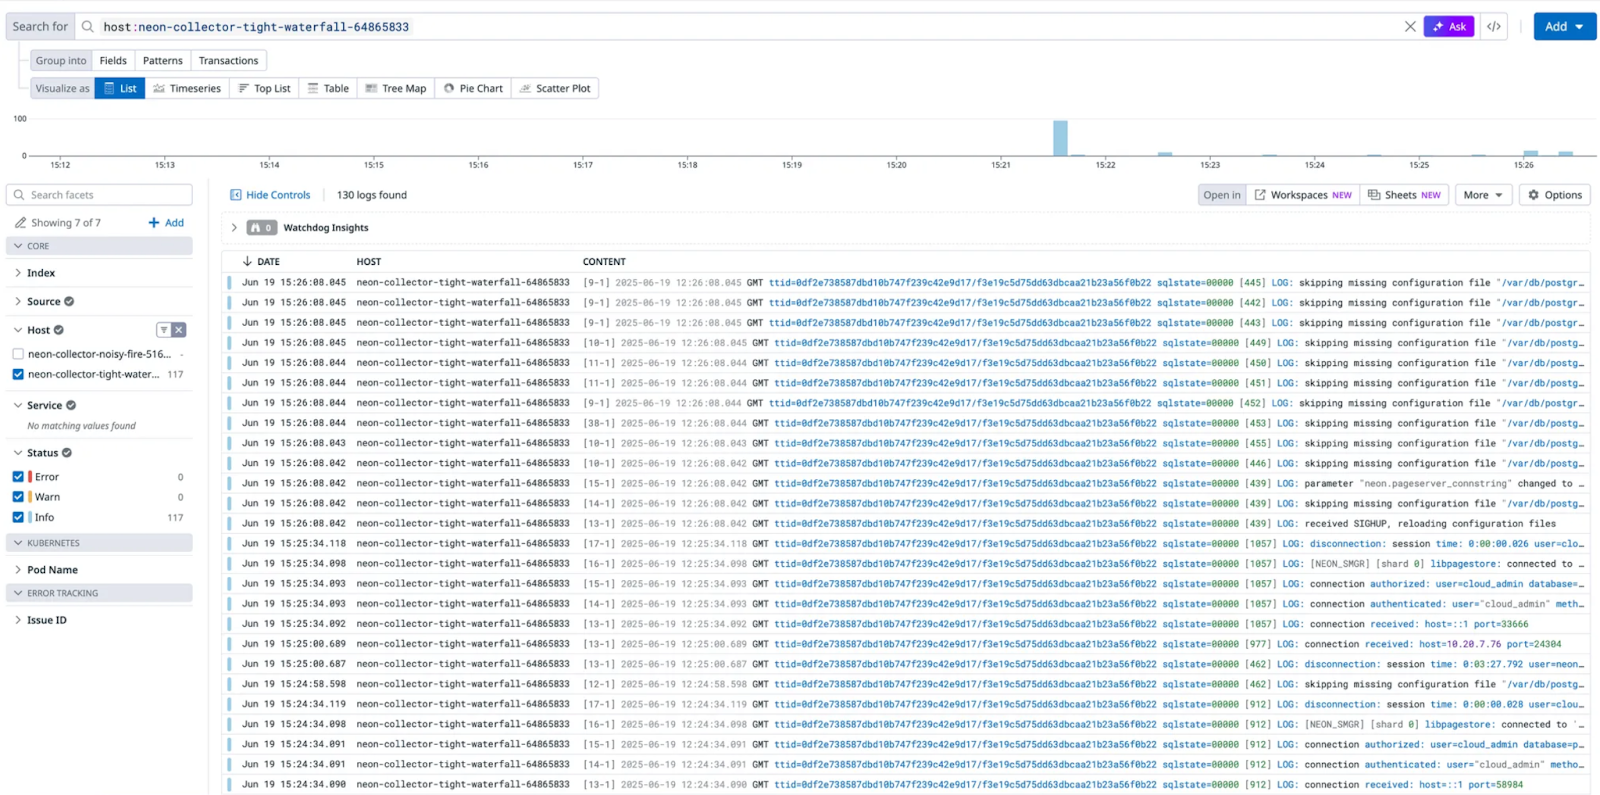
Previously, if you needed access to Postgres logs, you had to contact our support team and wait for a sample, which was not the best experience. Now, you can export logs alongside metrics directly to your observability platform, whether it’s Datadog or any OpenTelemetry-compatible service like New Relic. This gives you complete visibility into what’s happening inside your Postgres instance, from performance metrics to detailed logs, all in one place.
With logs readily available in your observability stack, you can troubleshoot faster, monitor behavior more effectively, and eliminate the need to go through support to access critical log data.
0 Comments
Log in to join the conversation.No comments yet. Be the first to share your thoughts.