
So at this point, our study is clear! We want to characterize how performance is impacted by scheduling threads auto-magically with the default Linux scheduler, with a "cache-optimized" scheduler, and with manual restriction of thread positions.
As many school projects go, we started a little close to the deadline, and followed a fairly linear train of thought to start testing right away. Our experimental setup was to track coherence actions (via read-for-ownership requests sent across the socket) and to track latency figures with the various configurations, and try to drill down exactly what aspect of runtime changing had contributed to performance increases/decreases. Since our benchmarks were all run with a thread count at/under the capacity of a single core, our proxy for an "idealized" placement across cores was to simply restrict benchmarks to a single socket via numactl as a control.
This led to one of the most striking results of our entire study: both the standard Linux scheduler and specialized LAVD scheduler perform approximately the same on our benchmarks, but using numactl to restrict thread scheduling to a single socket improved runtime by as much as 3x!
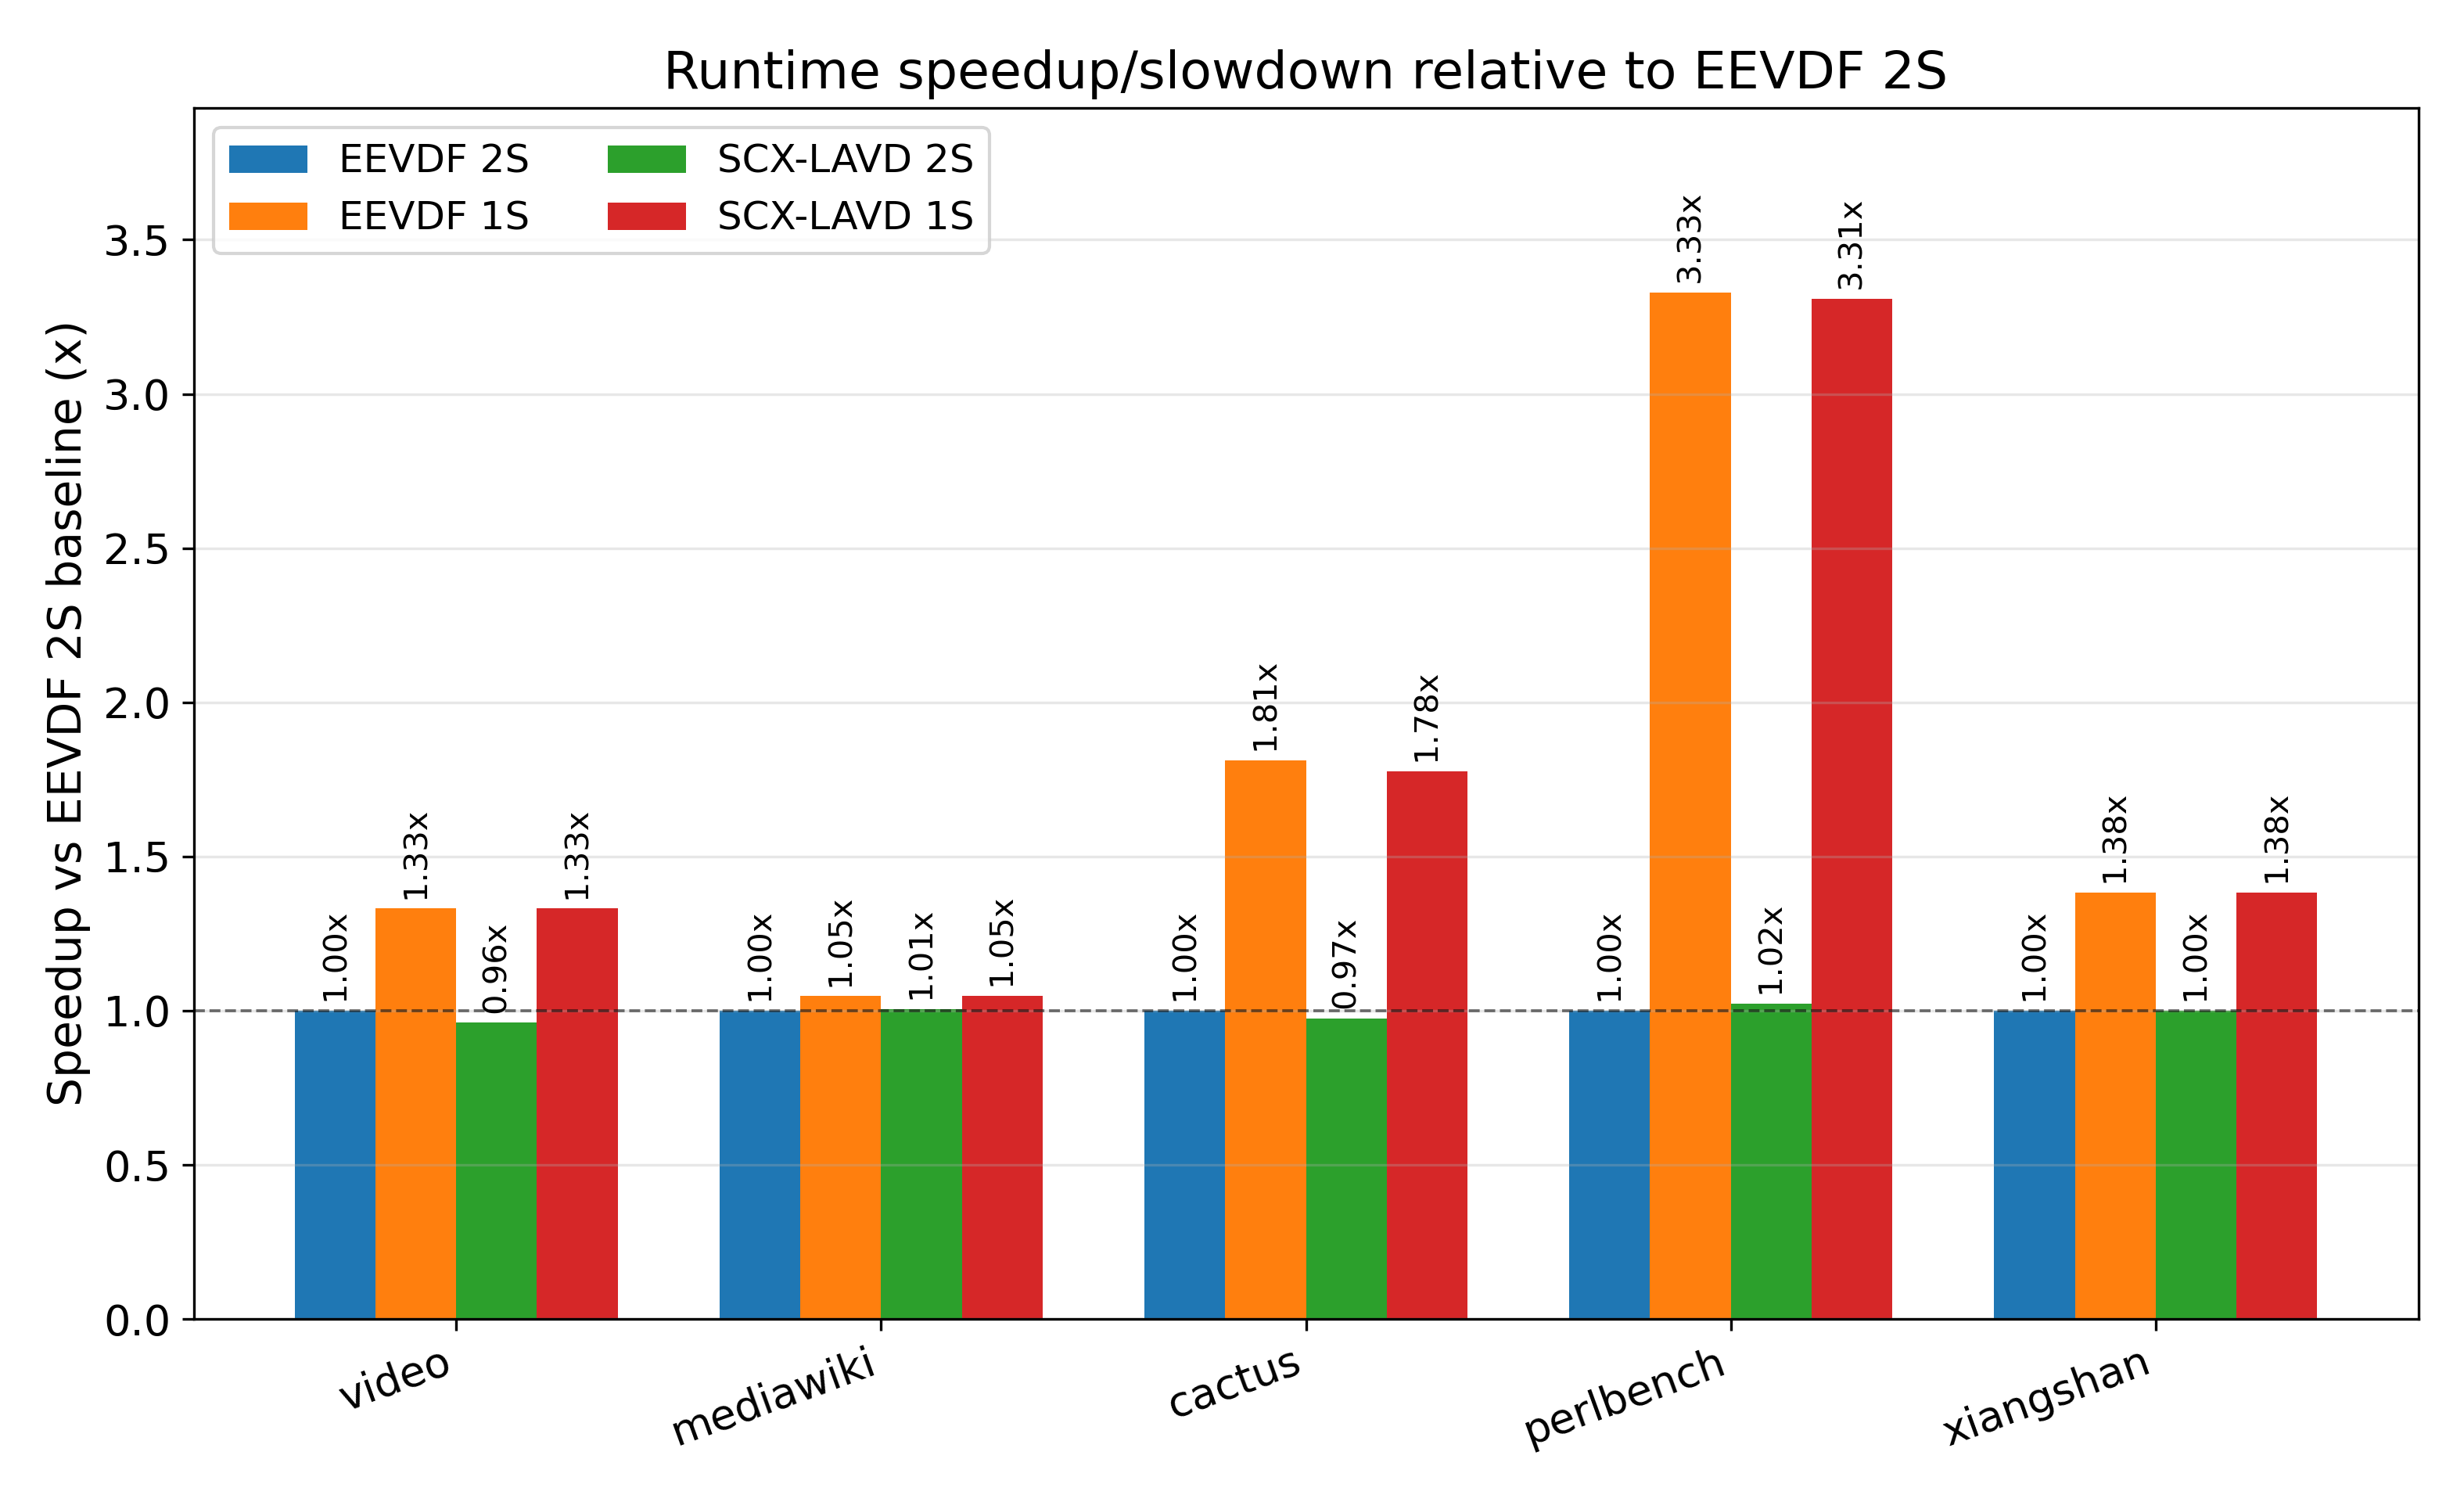
Figure 1: Normalized Speedup of Benchmark Runtime
So I guess if any of you are currently using a multi-socketed machine to run workloads in an under-subscribed fashion, I would recommend at least trying to use numactl to pin workloads to a single LLC domain or a set of cores – you can gain extreme speedup in multi-threaded shared-memory programs. This is mostly due to the fact that the Linux load balancer will try to ensure that all sockets are approximately equally loaded as thread count permits, even if that actively disadvantages the host program.
The salient exception to this observation was the mediawiki benchmark, which we sourced from DCPerf – how had the runtime barely moved at all? Maybe it was the fact that cache hitrates hadn't really improved?
Okay, we can check whether that's true. Let's take a look at if the number of read-for-ownership misses (e.g L3 wants to write to something but it doesn't have the data, so it asks the other core to let it own data) has changed. When we have strong write sharing, we expect that number to go up since shared cachelines should bounce between the two sockets' L3 caches.
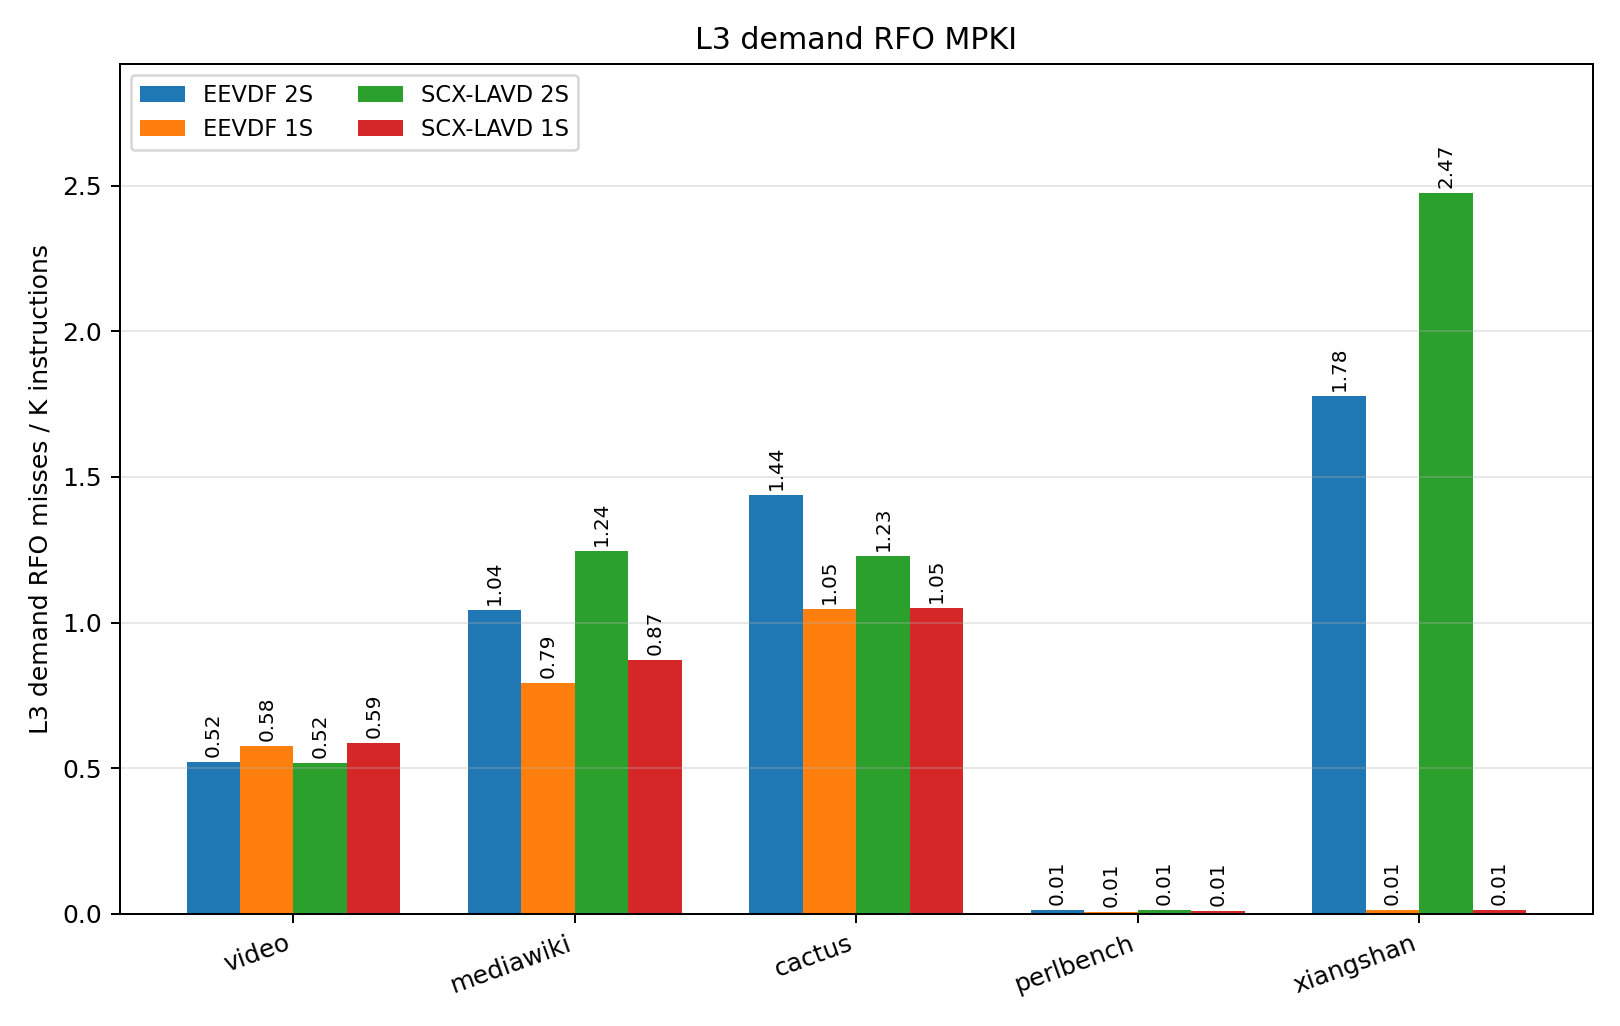
Figure 2: L3 Cache Read-for-Ownership Misses (per Kilo-Instruction)
Whelp. Now we have two mysteries.
- How has
mediawikinot sped up at all, even with an improvement in L3 RFOs? - What the hell is going on with
perlbench? What is making it speed up so much?
We didn't end up being able to answer either of these questions prior to the deadline unfortunately – in fact, we found this relationship the day our paper was due! So with a severe sleep deficit and copious amounts of caffeine in our bloodstreams, we took the time-old route of ignoring the issue, wrote that we hadn't been able to pin down the issue in our final report, and continued generating more plots. We ended up finishing the report at exactly 11:45PM, scampered over to Siebel and slid the report under our professor's door as fast as possible. And I don't think any of us really gave it another thought after submission.
Cut to a couple weeks after end-of-semester, and I was cleaning up the traces we'd used for this project. And for some reason I have since forgotten, I was curious what the MIPS was for each of these benchmarks.
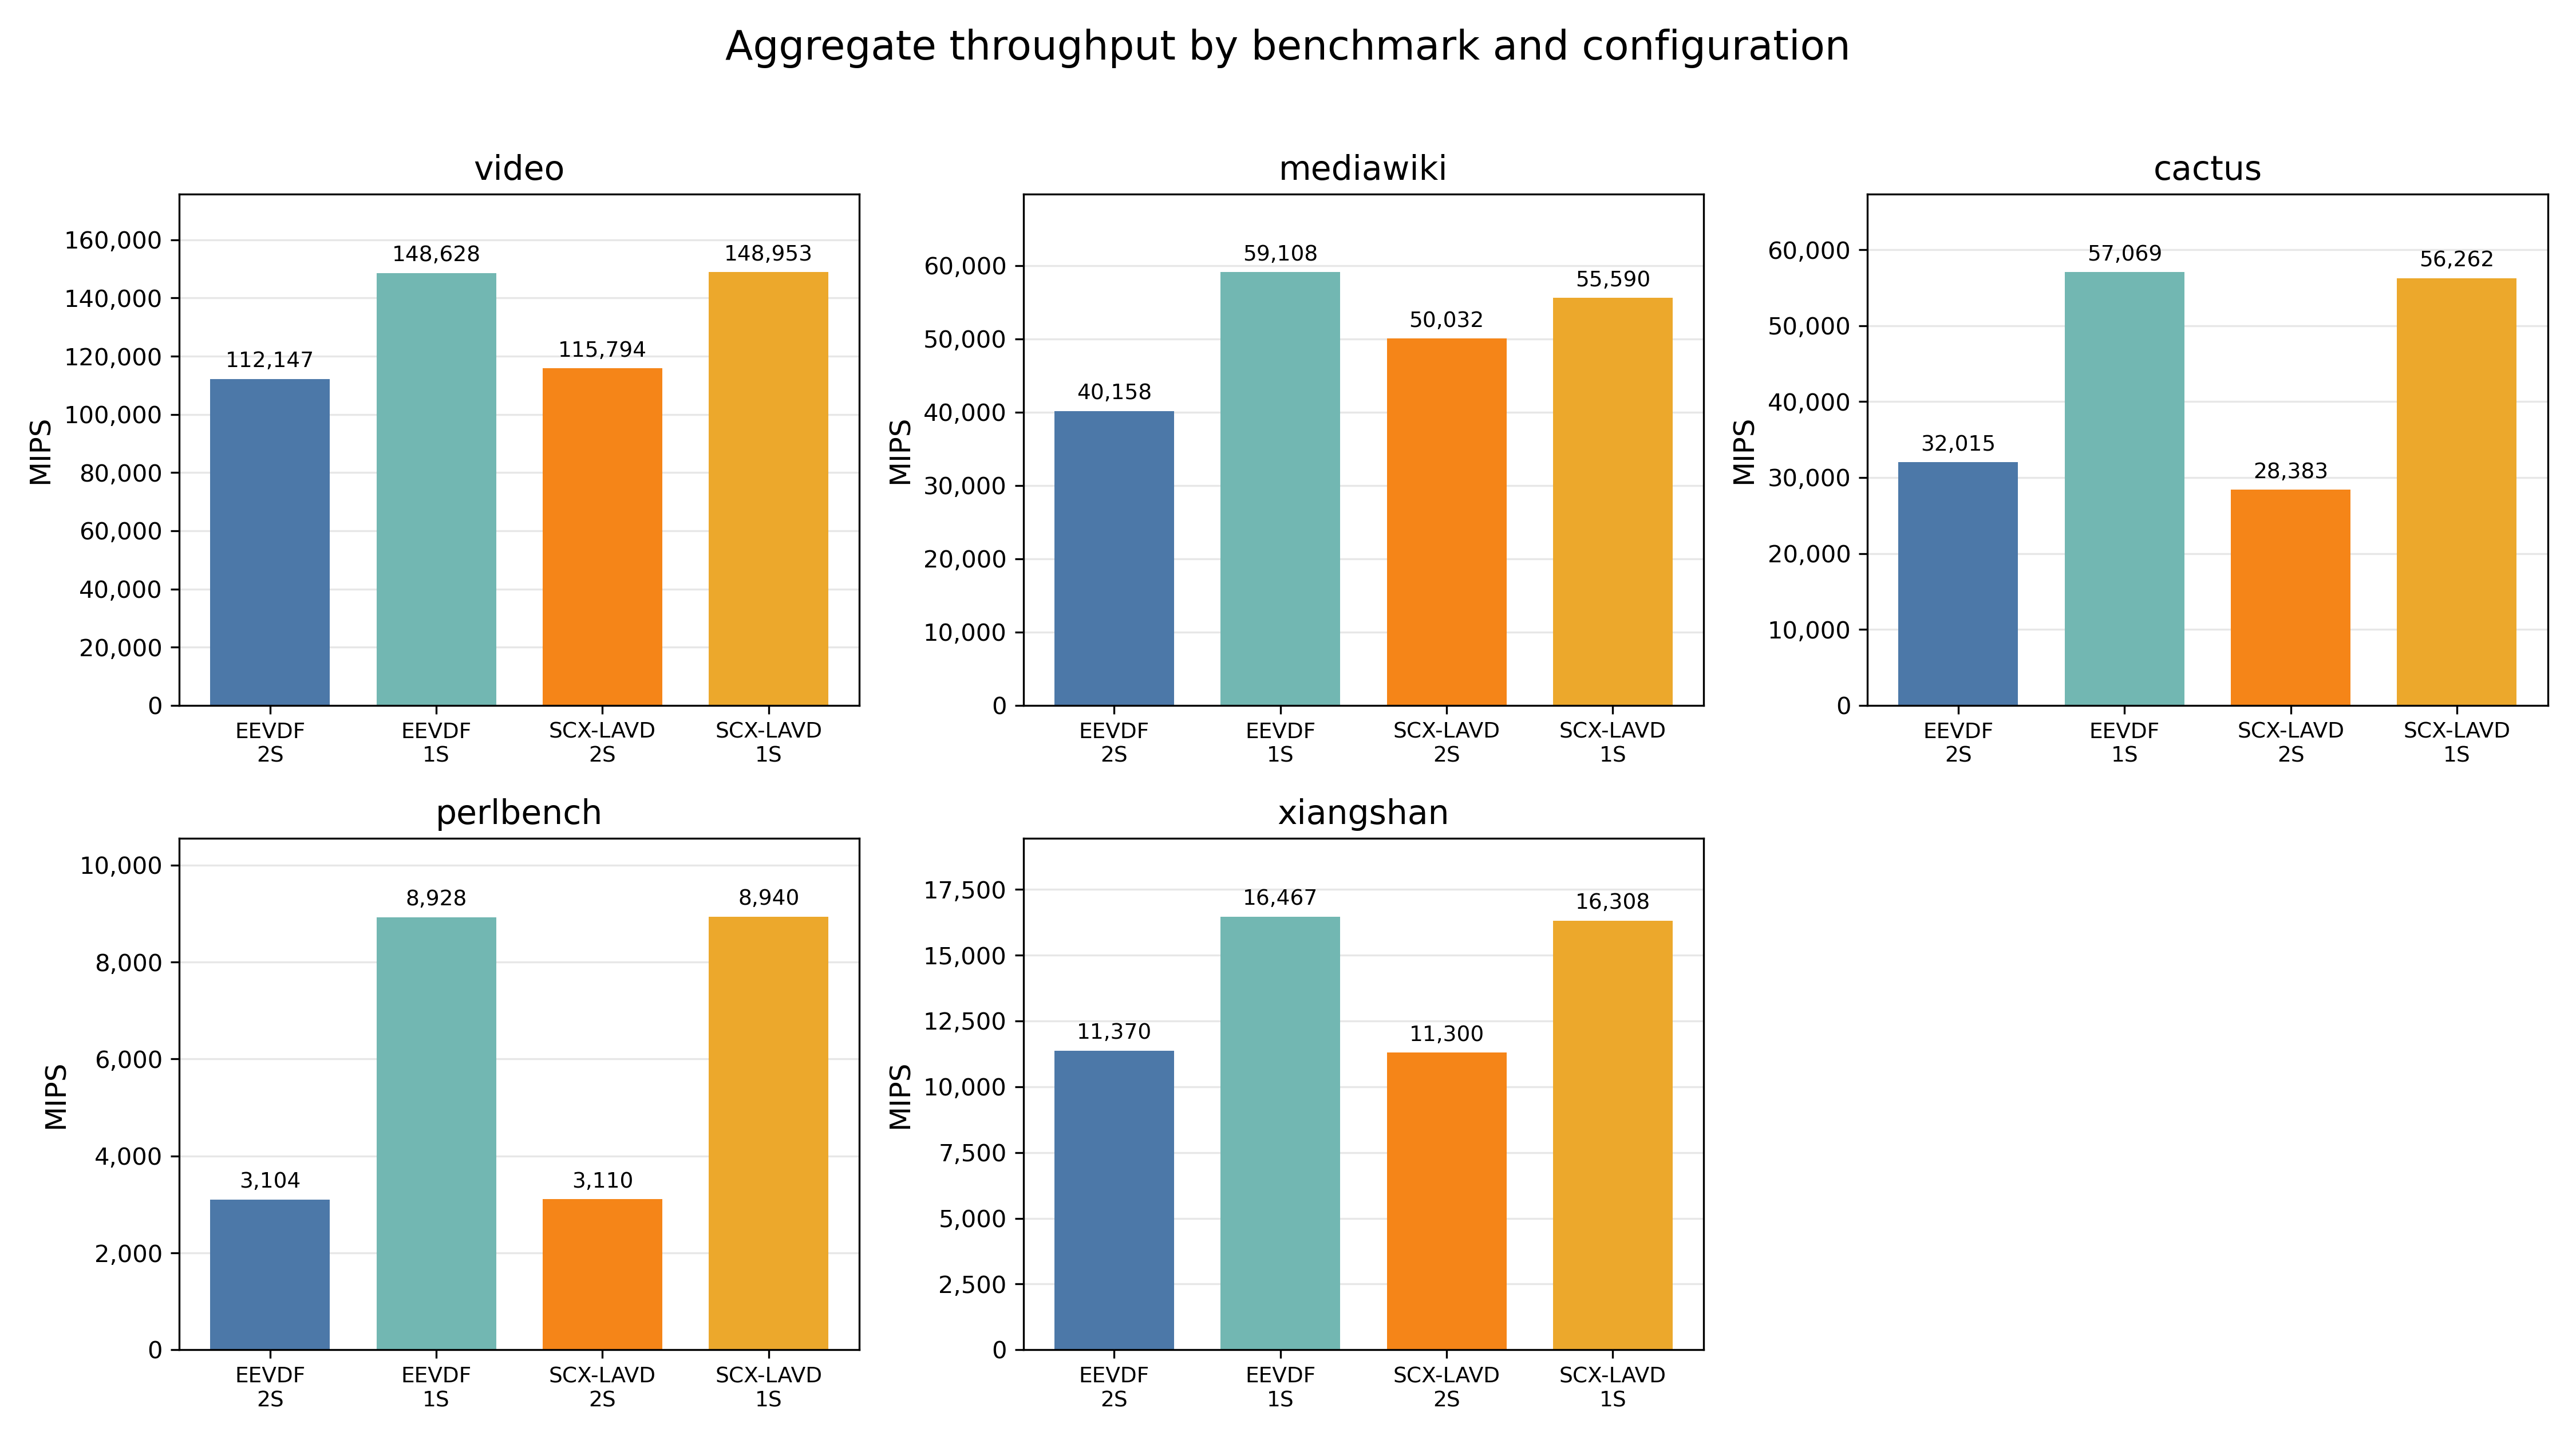
Figure 3: Throughput Measured as Millions-of-Instructions per Second (MIPS)
Well that makes… no sense. Throughput has gone up significantly but runtime hasn't changed?? What command did we use to run the benchmark?
cd /home/pradyun/pg_work/dcperf/
sudo ./perf_collect_mw "$JOBNAME" ./benchpress_cli.py run oss_performance_mediawiki_mlp \
    -i '{"scale_out": 1, "client_threads": 32, "duration": "10m"}' &
… Oh boy. Duration was fixed to 10 minutes. This directive was buried so deeply in our testing infrastructure, and reused so many times over the course of this project that we'd completely forgotten about it.
So in one shot, several mistakes have been made. Speedup was calculated with the assumption that instructions have been held constant, which was not the case for this benchmark. And not only have we accidentally reported another single-socket speedup as having been a phantom "no-change", we've also somehow masked the one datapoint that made LAVD look better. For the latter bit, my theory is that the nature of mediawiki suits the chain-of-tasks model that LAVD was designed for.
Side Note: LAVD was designed and optimized for the Steam Deck by Changwoo Min and the great folks over at Igalia. He had a pretty great talk about LAVD at OSPM25 which you can find here, would recommend watching!
0 Comments
Log in to join the conversation.No comments yet. Be the first to share your thoughts.