
I run HydraDNS, an open-source DNS security gateway in Go. Last month I sat down to find out what one box could actually handle before I put it on anyone else's network. The plan had a rule I'd written for myself: every number we discover becomes either a sales claim or a fix ticket. No number, no claim.
I expected to find one bottleneck. I found two, stacked on top of each other, and a third thing I wasn't looking for: a data structure in our own documentation that had never existed in the code.
Everything below was measured on a 22-core dev machine with load generated inside the container, using dnspyre, so docker-proxy and host networking stay out of the numbers. It's not appliance hardware and I'm not making appliance claims. The shapes are what matter.
The first ceiling: ~500 QPS, and it didn't care what I threw at it
The first redline run capped at roughly 500 queries per second. Fine, servers have limits. What made it interesting was that the cap didn't move. Blocked queries: ~500. Cached queries that never touch upstream: ~500. Two code paths that do completely different work, hitting the same wall, with the CPU sitting under 30% of 22 cores.
That signature is worth memorizing. When two very different paths hit the same ceiling and the CPU is bored, the bottleneck isn't in either path. It's in something they share, or something upstream of both.
Ours was in the blocklist check. IsBlocked ran a SQL COUNT against a 92k-row blocklist_entries table on every query. Not just candidate blocks, every query, because the check sits in front of the cache, so even cache hits paid for it. And all of those reads were serialized through a single SQLite connection, MaxOpenConns=1, which was also absorbing the async write traffic from query logging.
The engine's self-measured latency under load: p50 of 50ms, p99 of 5000ms. Five full seconds at the tail, for DNS, which is supposed to be the fast part of the internet.
The part where I found out our docs were lying
Here's the uncomfortable bit. Our feature sheet, and two other internal docs, said the blocklist was backed by a Bloom filter. Sub-millisecond membership checks, the whole pitch. Neither thing was true.
There was no Bloom filter. There never had been one. The policy engine has one, a real one, with tests. The blocklist never did. Somewhere along the way "we should use a Bloom filter" became "we use a Bloom filter" in a document, and then the claim got copied into another document, and after it existed in three places it read like an established fact. Three docs, zero source files.
Nobody lied on purpose. A plausible sentence got written once and nothing ever checked it against the code. I only caught it because the stress test forced me to look at what the hot path actually did, and what it actually did was a table scan's worth of SQL per packet.
So the fix wasn't "tune the Bloom filter." The fix was to build the in-memory layer the docs had been imagining. MemoryChecker: an atomic in-memory domain set, loaded at startup, swapped wholesale on the existing 6-hour blocklist refresh. The parent-domain walk (block example.com, and ads.example.com matches too) reproduces exactly the candidate set the SQL version checked, so behavior didn't change, just the cost.
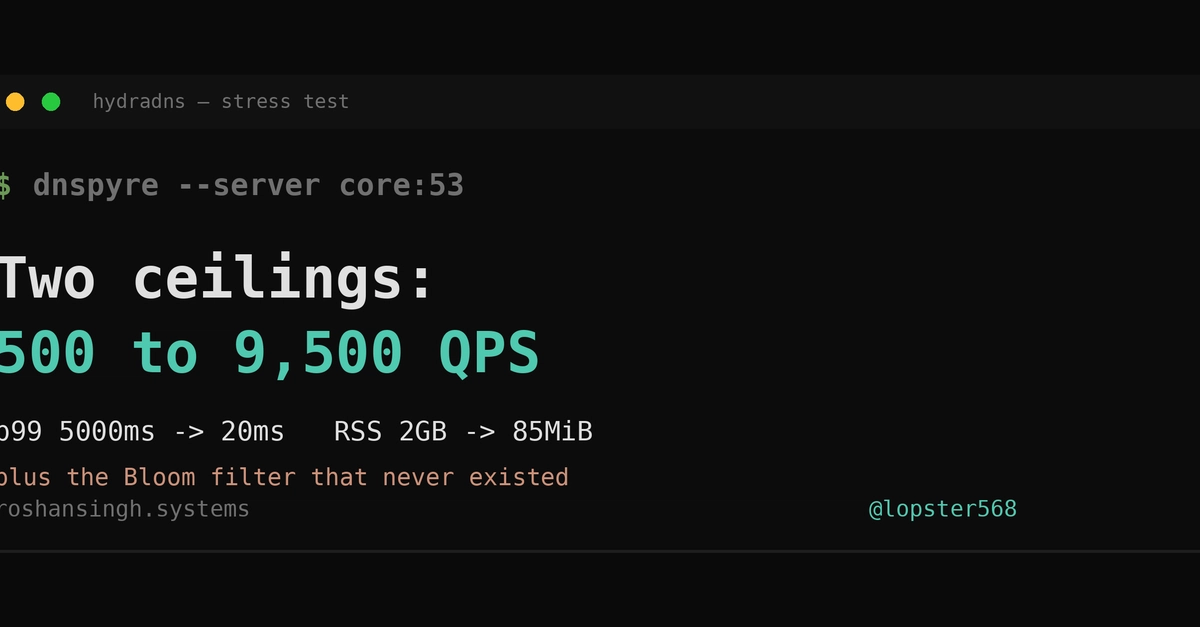
Throughput went from ~500 to ~9,500 QPS. Nineteen times, from moving one membership check off the database. Not a clever data structure. A map, held in memory, reloaded every six hours.
The second ceiling was hiding behind the first
With reads fixed, I re-ran the redline, and the box got fast and then started eating memory. RSS climbed from 98MiB to a bit over 2GB as offered load went from 500 to 10,000 QPS.
It drained back to normal when the load stopped, so it wasn't a leak, it was a backlog. But a 2GB transient spike is academic only until you remember the target hardware has 2 to 4GB of RAM total. On the appliance this is an OOM kill in the middle of a traffic burst, which is the exact moment you don't want your DNS to die.
The cause: query logging spawned a goroutine per query, and each one did an INSERT plus a stats UPDATE through that same single SQLite connection. At 500 QPS the queue drained fine and nobody noticed. At 10,000 QPS, goroutines piled up faster than one connection could ever clear them. The first bottleneck had been rationing the second one. Lift the read ceiling and the write bomb goes off.
"Async logging" is only safe if it's bounded. Unbounded goroutine-per-event isn't async, it's a memory spike with extra steps, and it just moves the failure from slow to OOM.
The replacement is querylog_writer.go: one writer goroutine, a bounded channel of 4,096 entries, batches flushed at 256 entries or 500ms, bulk INSERT plus a single aggregated stats UPDATE per batch. Enqueue is non-blocking. If the buffer is full, the entry is dropped and the drop is counted, because losing a log line is an acceptable failure for a DNS server and stalling resolution is not.
After: RSS flat at ~85MiB from 500 to 10,000 QPS. Engine latency p50 5ms, p99 20ms. CPU at 10k QPS dropped from 56% to 14%, because it turns out scheduling tens of thousands of goroutines was itself a workload.
The numbers, before and after
Throughput ceiling:   ~500  -> ~9,500 QPS   (19x)
Engine p99:           5000ms -> 20ms
RSS at 10k QPS:       2,063MiB -> ~85MiB
CPU at 10k QPS:       56% -> 14%
Enter fullscreen mode Exit fullscreen mode
Then a 3-minute soak to confirm the shape holds: 248,166 queries at 1,379 QPS, zero engine errors, RSS a bounded sawtooth (119 to 139 to 114MiB as GC does its thing) instead of the old monotonic climb.
The soak that almost passed on an idle box
One more confession, because it's the most useful lesson in here. My first soak attempt reported beautifully. Flat memory, no errors, perfect.
It had also sent zero queries. Deploying the retention change had recreated the container, which wiped the dnspyre binary inside it, and the docker exec failures were being swallowed by a 2>/dev/null I'd added earlier. The harness "ran," measured an idle server, and called it healthy. I caught it only because the sent-count looked suspiciously round: zero.
If your load generator's failure mode is silence, your benchmark's failure mode is a false pass. Now the harness asserts the sent count before it's allowed to report anything.
What I'd take to your codebase
- Same ceiling on two different paths plus idle CPU means the bottleneck is shared or upstream. Stop optimizing the paths.
- Fixing one bottleneck unmasks the next. The box's real limit is wherever you stop looking.
- Bound every async path. A queue without a cap is an OOM with a delay on it.
- Dropping data beats stalling the hot path, if you count the drops.
- Verify advertised internals against the code. Our "Bloom filter" lived in three documents and zero files, and it survived because every reader checked it against another document instead of the source.
That last one is the one I keep thinking about. The expensive bug wasn't in the code. It was in the docs, quietly shaping what everyone believed the code did.
I do this work for hire, mostly making LLM agents safe and observable against production infrastructure, and occasionally chasing a database off a hot path. Scope and pricing are at roshansingh.systems/#hire, or write to [email protected].
0 Comments
Log in to join the conversation.No comments yet. Be the first to share your thoughts.