
ObservabilityCON 2026: Register today and preview this year's agenda
It’s time to reserve your spot at ObservabilityCON 2025, our flagship observability event, taking place 7-9 October in London.
@grafana-blog
Publisher
17
Posts
It’s time to reserve your spot at ObservabilityCON 2025, our flagship observability event, taking place 7-9 October in London.
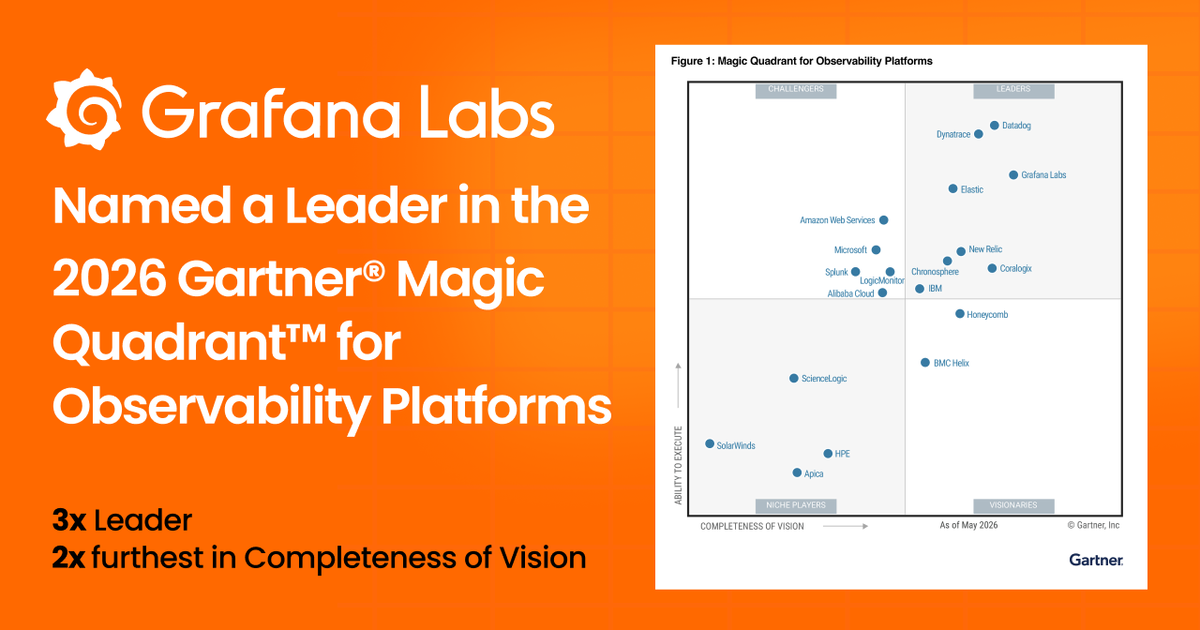
Grafana Labs has been recognized as a Leader in the 2026 Gartner® Magic Quadrant™ for Observability Platforms for the third consecutive year.
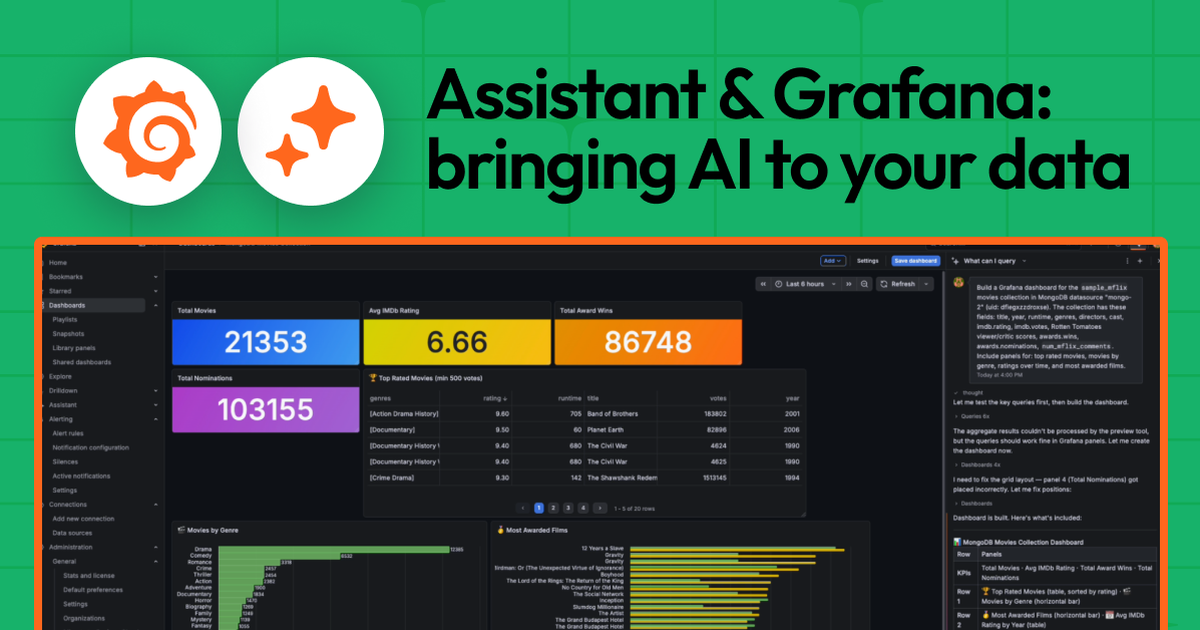
Assistant can query and read your data using natural language, correlate signals across more than 30 sources in a single investigation, and visualize results directly as Grafana dashboards.
Learn how Grafana Cloud Synthetic Monitoring, Frontend Observability, and k6 work together to create a layered reliability testing strategy that catches issues early, surfaces real user impact, and validates performance under load.
Eric Burns of Anthropic discusses betting early on running across the major clouds, natural language as the new UI for dashboards, and how agentic coding tools have changed software development.
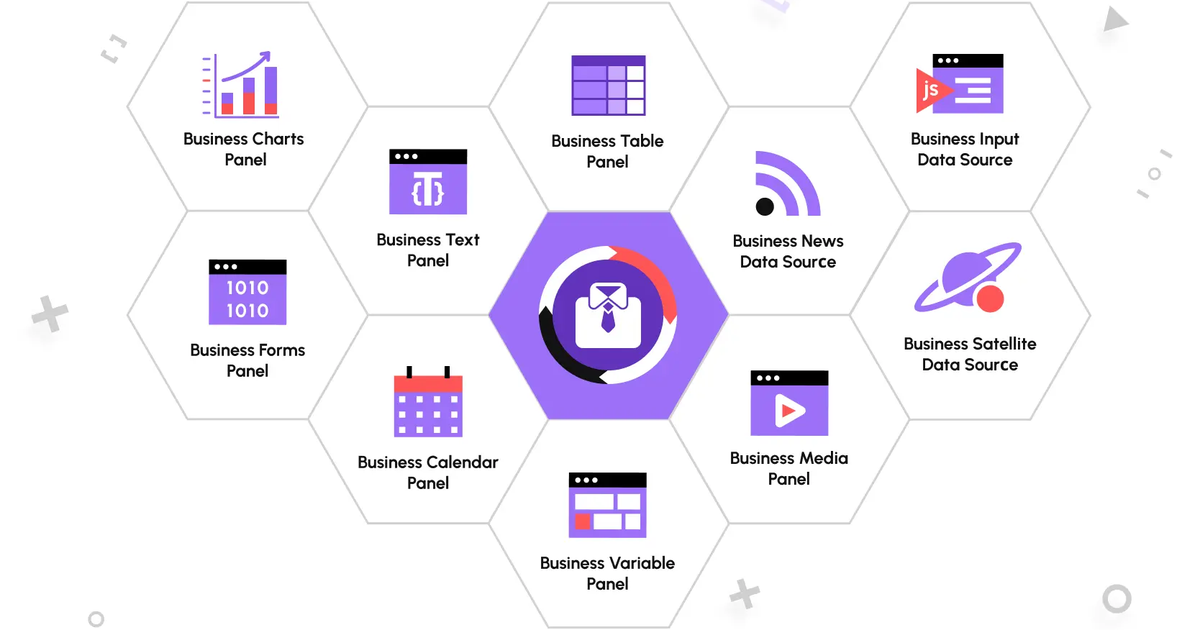
We're extending maintenance for Grafana BI plugins through the end of 2026. Here's what we've learned from the community and what you can expect for support going forward.
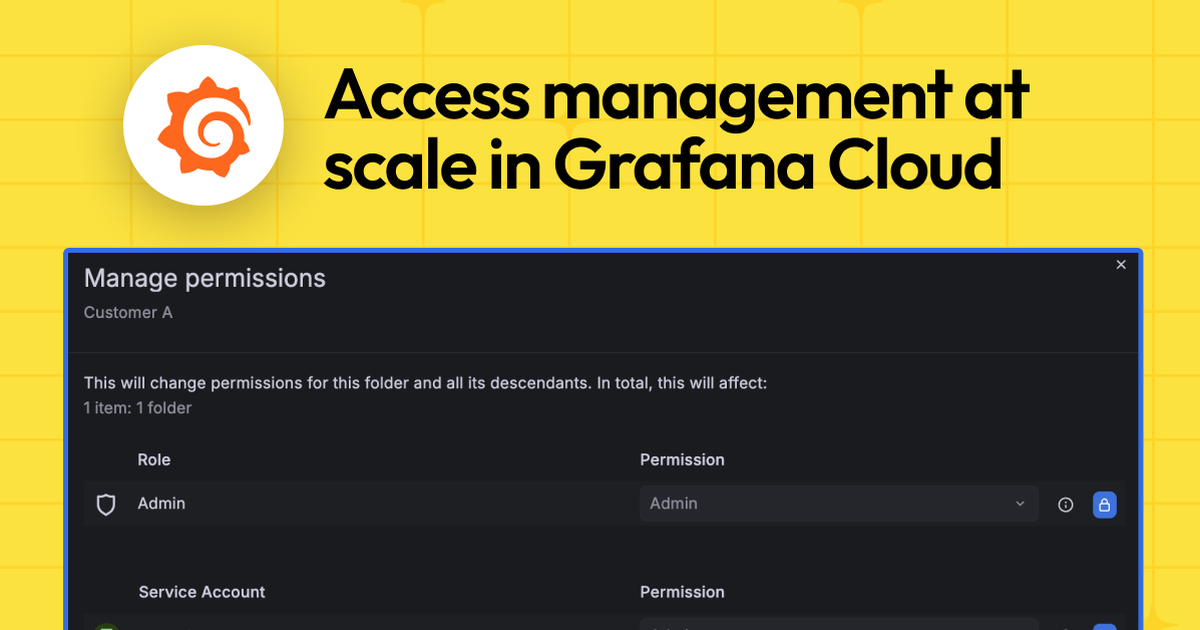
Learn how to use a layered access model that allows organizations to onboard large numbers of users, both internal and external, without sacrificing control.
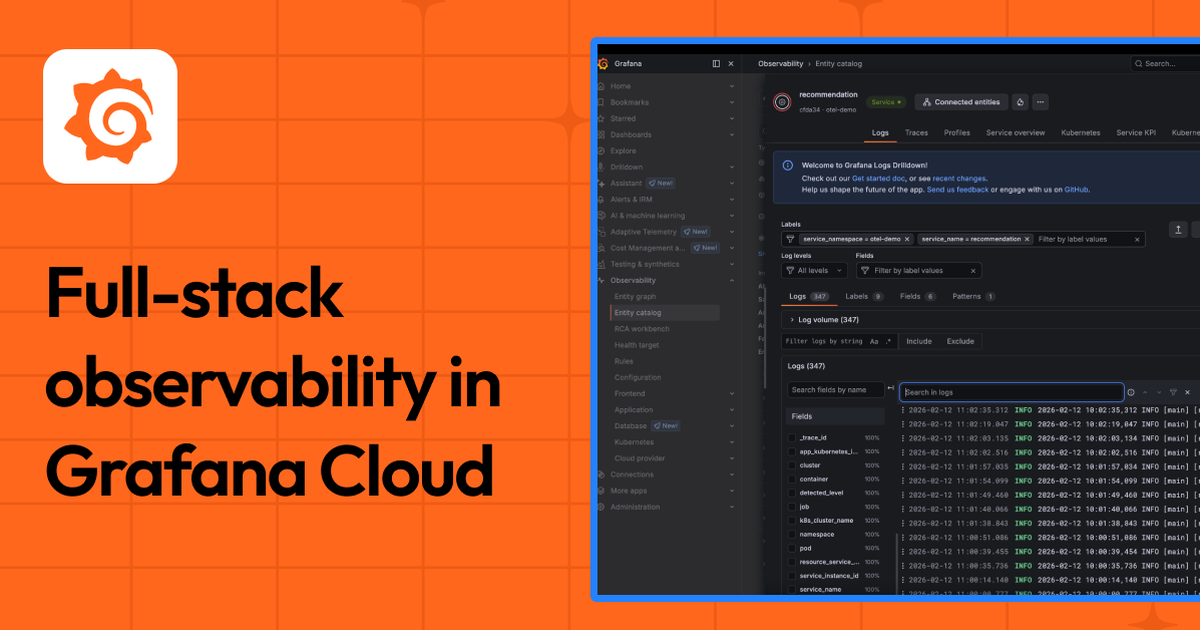
With a full-stack view across applications, infrastructure, and Kubernetes environments, Grafana Cloud lets you investigate from a service, pod, or cluster and quickly drill into telemetry data to identify root causes.
Grafana 13.1 expands observability as code capabilities, extends Grafana Assistant to additional data sources, and delivers workflow improvements that make it easier for teams to visualize, analyze, and act on their data.
We completed our internal investigation of the recent TanStack supply chain ransom incident and confirmed our initial findings: The incident was strictly limited to the Grafana Labs GitHub environment. There was no unauthorized access to customer production systems, and the Grafana Cloud platform...
We’re excited to share that ObservabilityCON, our flagship observability event, will take place in London this October.
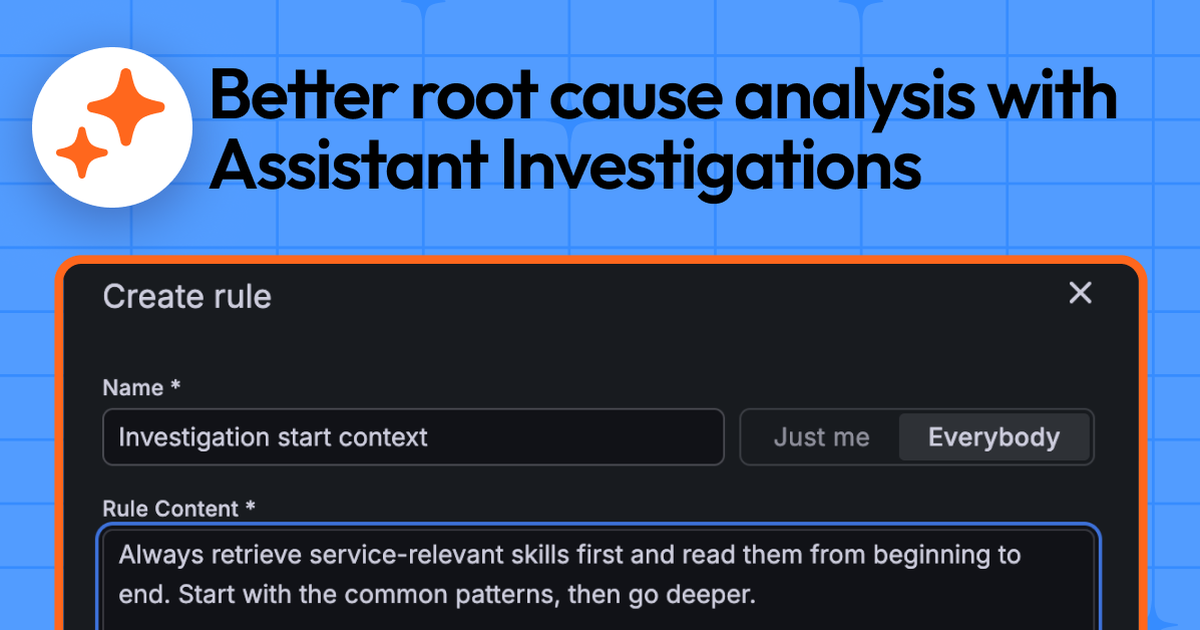
Discover all the ways Assistant Investigations can help you improve your incident response so you can run your own “human on the loop” auto-remediation workflows at scale in Grafana Cloud.
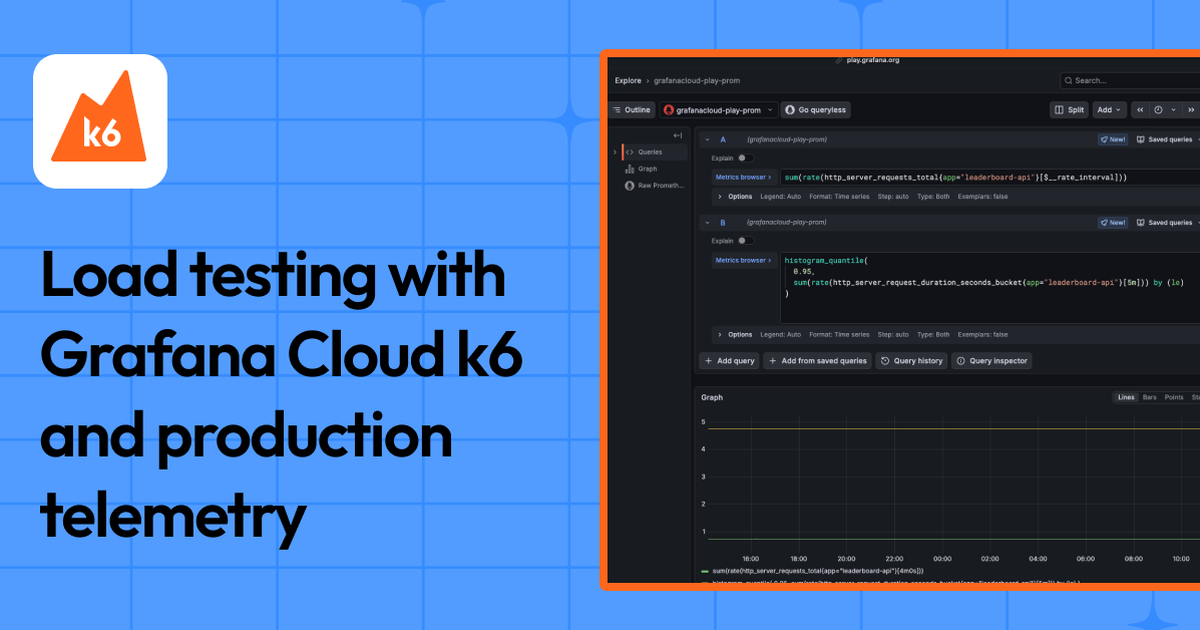
By pulling real telemetry signals from Grafana Cloud and translating them into Grafana Cloud k6 testing scenarios, your load test results become far more meaningful.
The latest major release of Tempo delivers a new architecture that cuts storage costs and scales reads and writes independently.
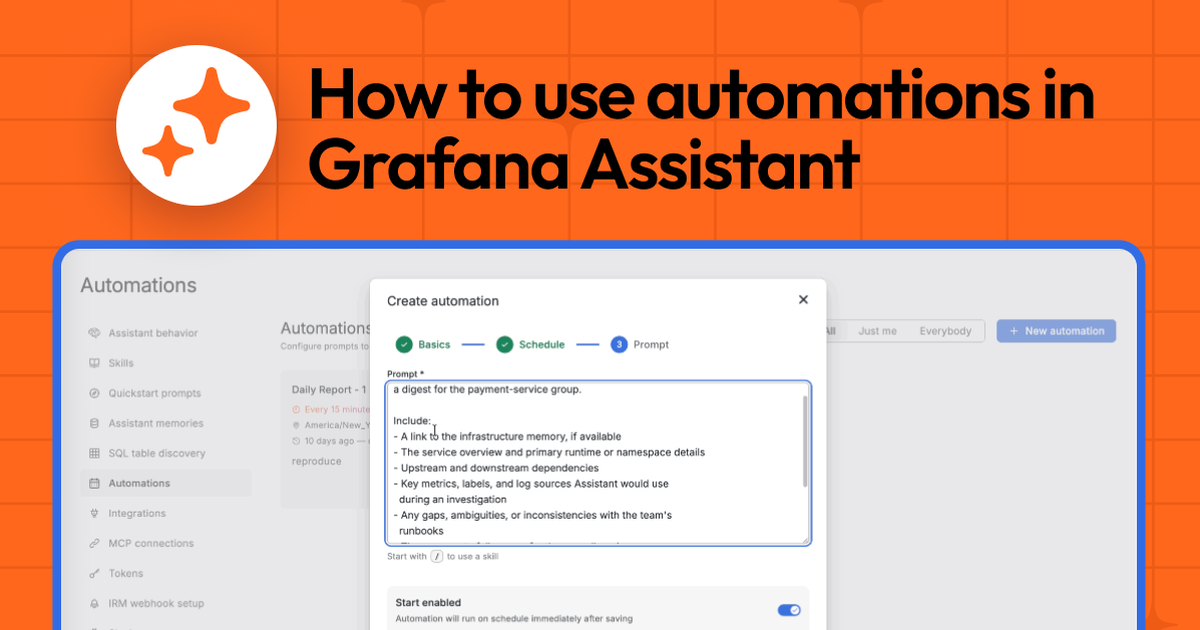
With automations, a new feature in public preview, you can take a working prompt or skill, schedule it, and let Assistant run it in the background so the answer is ready when you need it.
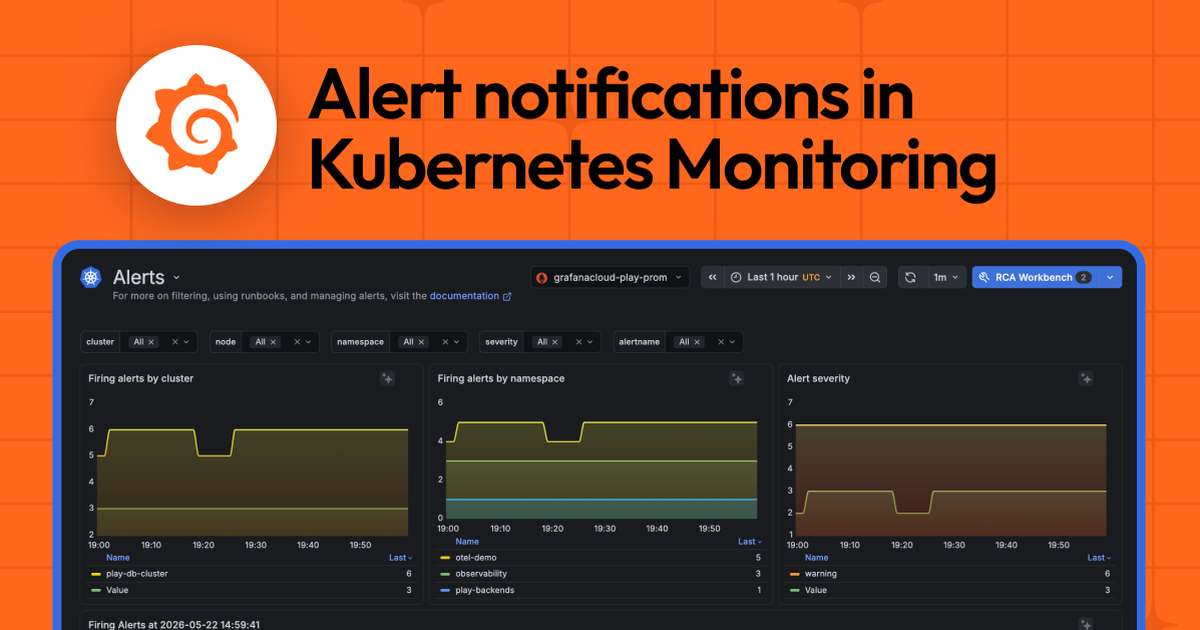
If you've recently reinstalled Kubernetes Monitoring and your alert notifications stopped arriving, or started looking different, you're not alone. This post explains what changed, why it happened, and what to do about it.
All GrafanaCON 2026 sessions are now available on demand—including Grafana 13, Loki's new architecture, k6 v2.0, Pyroscope 2.0, and community stories from Irish Rail, Google, ESnet, and more.