
30 to 70 PRs a Day: How We Managed to Not Wreck Our Systems
The Honeycomb engineering team set out to double our productivity in a year. This is how we did it, what we did to keep things stable, what it cost us, and what we’re still figuring out.
@honeycomb-blog
Publisher
57
Posts
The Honeycomb engineering team set out to double our productivity in a year. This is how we did it, what we did to keep things stable, what it cost us, and what we’re still figuring out.
In this two-part blog series, I give a detailed report-out on how our Honeycomb engineering team 2. 5x-ed our throughput using AI without breaking everything or lowering our standards for quality.
How we pulled off a large-scale Kafka migration project by learning from past mistakes, prioritizing rollback safety, and building shared knowledge.
The world is especially hard right now. The future of the software engineering profession looks more uncertain than ever.
In this blog, learn why Juliana built Lattice Watch—an AI-assisted code review tool—to improve design system adherence at Honeycomb.
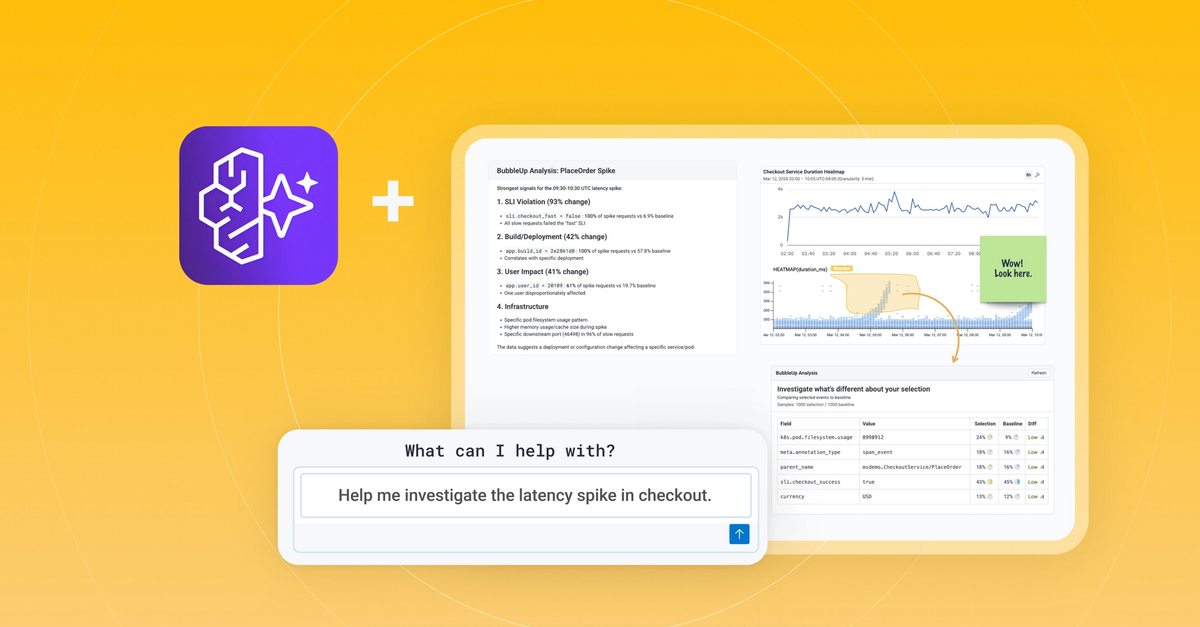
This post was co-written with Staff Software Engineer Martin Holman . Honeycomb Canvas is a collaborative investigation environment.
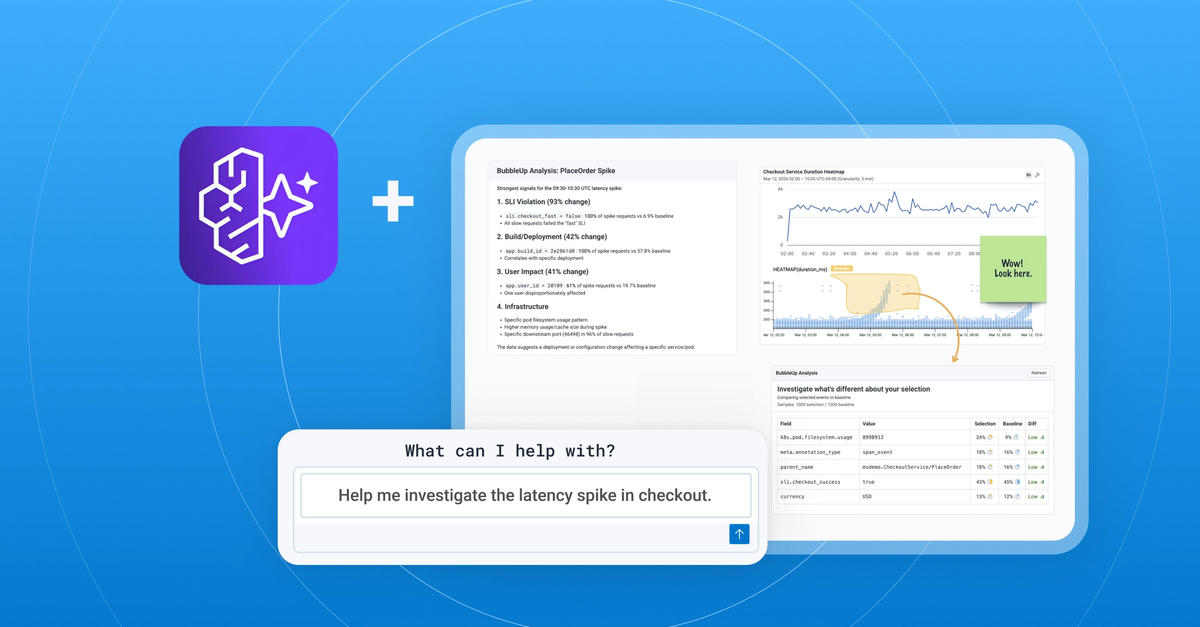
This post was co-written with Staff Software Engineer Martin Holman . "Hello world, this is your agent speaking!

As of today, I’ve drafted this post upwards of 10 times—it’s old enough that the version I first started working on was called “Reflections on 1 Year of SRE Management” (I’m currently at 2. 5 years).
At O11yCon , we talked to engineering teams across the industry, and the numbers are starting to get genuinely wild: Mixpanel DevOps Engineer Eddie Bracho told us their engineering team is generating 50% more PRs than before AI came into the mix (sorry). That kind of velocity is exciting, but i...
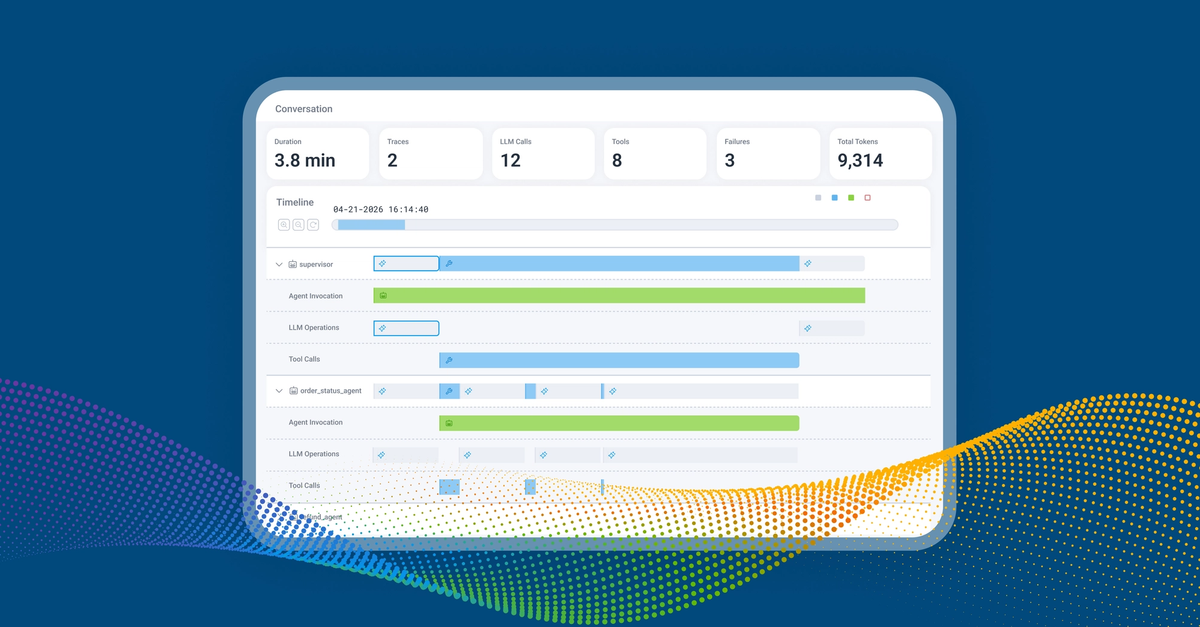
AI agents are nondeterministic, multi-step, and opaque. When one fails in production, "the model said something weird" is the cheapest, most useless line in your incident postmortem.
On May 4th in the EU instance, and May 7th in the US instance, Honeycomb ran its only scheduled maintenance session with major planned downtime in the last five years. During the maintenance window, Honeycomb kept accepting your events, but recent data was not queryable while the work was underw...
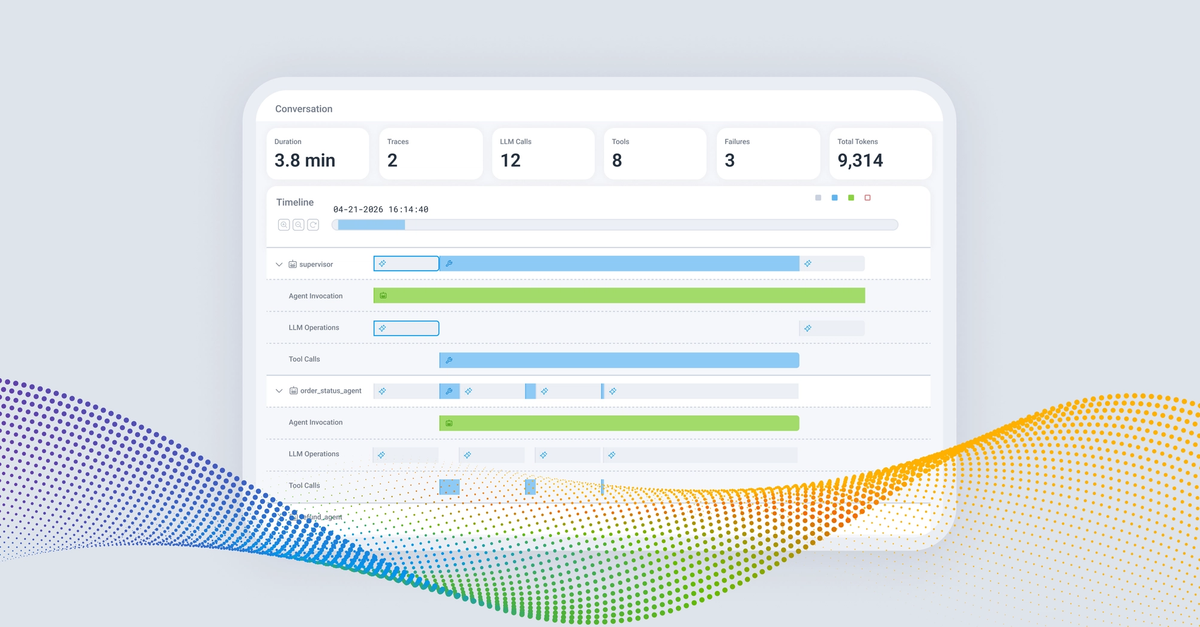
Honeycomb’s Agent Timeline gives you a unified view of LLM behavior and multi-agent workflows. Now generally available!
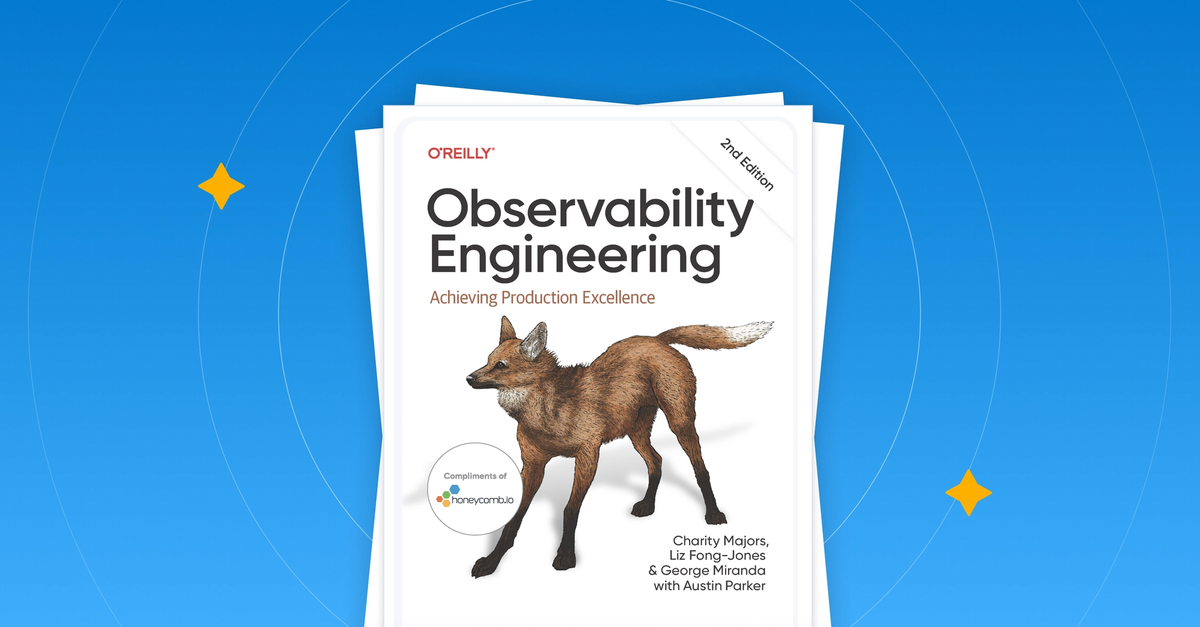
IT’S HERE it’s here it’s here it’s here!!!! The second edition of Observability Engineering is available for download, and since Honeycomb is the sponsor, you can now download it from our website (the dead tree version will take another month).
Old observability metrics like uptime and MTTR aren't enough anymore. Teams must connect technical signals to business outcomes, like savings and speed.
This is the fourth installment in the Graviton retrospective series we've been writing since 2021. The methodology is the same one I always reach for: hold the workload constant, run both generations on the same Kubernetes namespace concurrently, and let the per-pod numbers speak.
The OpenTelemetry Collector is usually deployed as a long-running process: a sidecar, a DaemonSet, an EC2 instance, a docker container on my computer. It sits there listening for telemetry.
You’ve probably read this quote in relation to any number of things over the years. People complaining about arbitrary metrics like PRs merged, lines of code produced, and now, token usage.
You'd think that working at an observability company means everyone knows exactly where to find everything in the data. It doesn't.
Dynatrace is a full-stack observability and application performance monitoring (APM) platform designed for large-scale enterprise environments. It became popular because it combined infrastructure monitoring, APM, logs, digital experience monitoring, and AI-assisted root-cause analysis into a si...
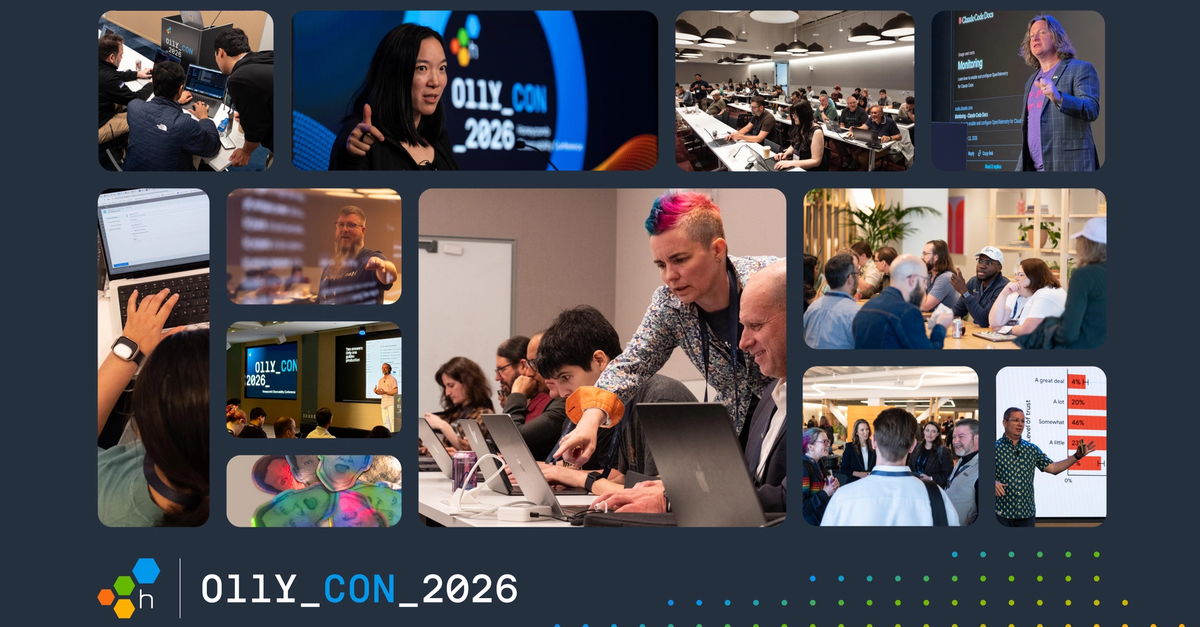
We just wrapped O11yCon 2026, and this year's conversations hit differently. Agent-based software development is here, now .
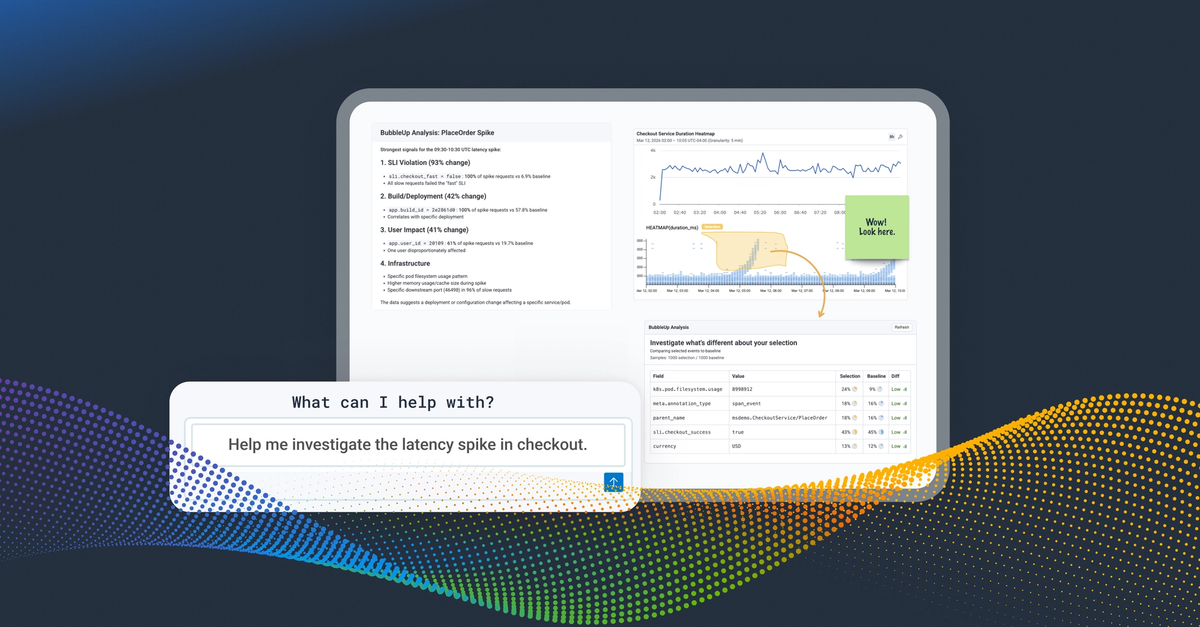
Last week , we launched a major update to Canvas, our investigation workspace. The new Canvas has evolved from an AI co-pilot you chat with to a place where your whole team, human and agent, can work the same problem on the same surface.
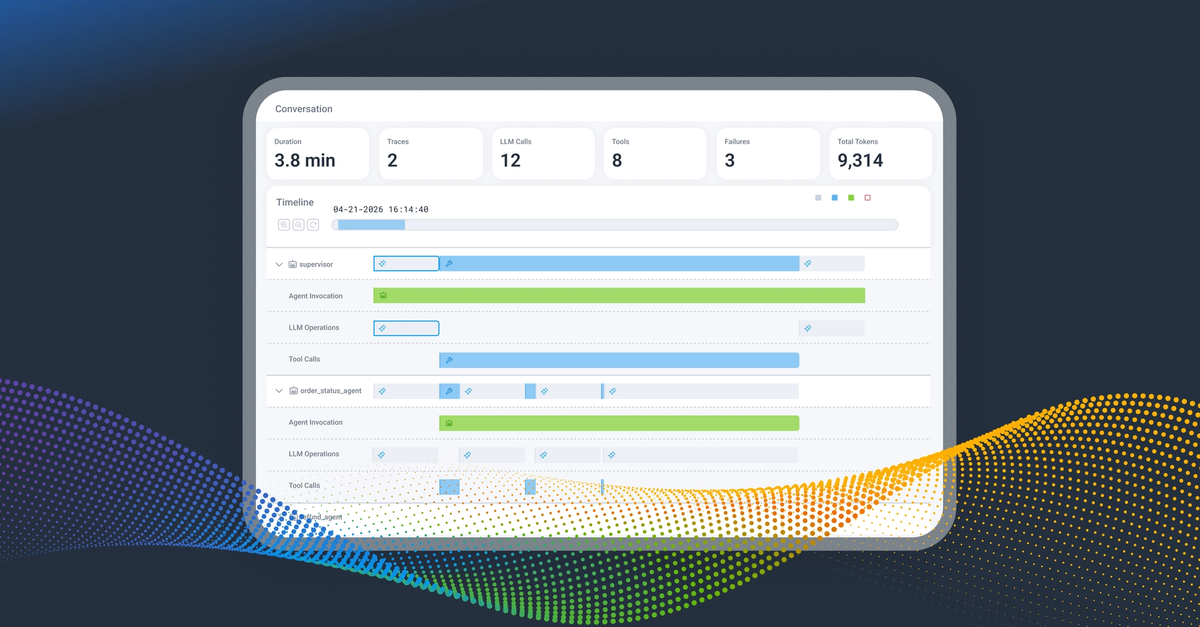
Last week , we introduced Agent Timeline, a powerful new observability experience purpose-built for debugging AI agent workflows in production. Agent Timeline uniquely connects AI-layer visibility to full-stack observability by organizing telemetry around an agentic conversation.
From Honeycomb’s perspective Customers regularly come to us looking to solve their observability problem by connecting the dots from frontend to backend. It sounds straightforward in theory, but in practice it's one of the hardest problems in modern application monitoring.
Honeycomb is proud to share that we have achieved the Amazon Web Services (AWS) Financial Services Competency. This recognition validates our technical expertise and proven customer success in assisting financial services organizations with building, running, and understanding their production s...
AI is reshaping the SDLC in two directions at once. AI-generated code is shipping faster and with less human supervision than ever before, while agents and LLMs are running directly in production, where they behave very differently from traditional software: non-deterministic, with a wider blast...
The software development lifecycle is collapsing. The multi-stage pipeline that defined how software got built and shipped for decades is compressing into rapid loops of intent and validation, with agents now part of the teams building and running it.
Your dataset has hundreds of attributes. Some are self-explanatory: http.
More attributes on one span means more correlation power and cheaper telemetry. Learn when to reach for spans or logs instead in OTel custom instrumentation.
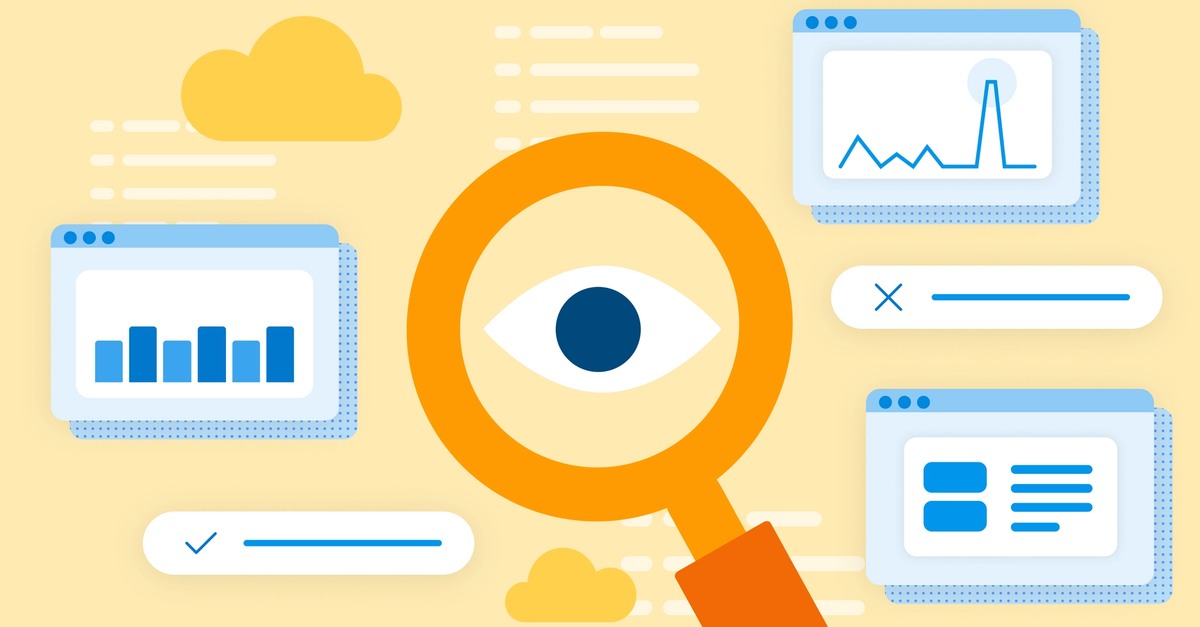
Grafana is one of the most widely adopted visualization and monitoring tools in the observability space. Its open-source roots, flexible plugin system, and native support for Prometheus, Loki, and Tempo have made it a default starting point for many engineering teams.
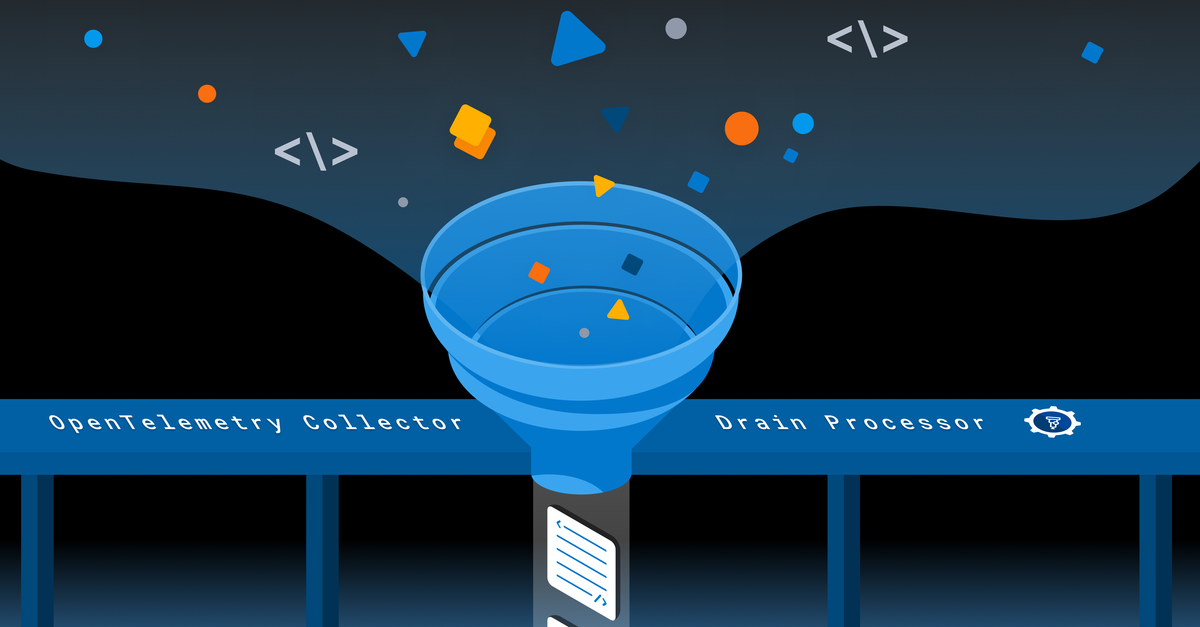
Do you receive 50 million log lines per day and struggle to see what actually matters? Health checks, heartbeat pings, connection pool messages—they all drown out the errors and anomalies you're trying to find.
The Honeycomb MCP course in the Honeycomb Academy gives you a starting point when you're not sure what to ask and teaches you how to direct an investigation.

A parhelion is created when light refracts through hexagonal ice crystals in the atmosphere, forming bright spots that appear on the horizon, connected by a faint halo. You don’t have to squint very hard to appreciate how relevant this is to our current AI moment, where we’re surrounded by token...
Real production data tells the story better than I can. Juraci Paixão Kröhling , a friend and fellow observability practitioner at OllyGarden , recently shared an example from an anonymized production environment: 1,830 occurrences of http.
Are you writing agentic applications, but aren’t sure what the agents are doing? Finding out too late that you've blown the budget with super expensive models?

Last week was a great reminder for me about the challenges of the traditional model of observability defined by the “three pillars” of metrics, logs, and traces. One of the customers I’m currently working with is a large financial institution that has a robust three pillar implementation.
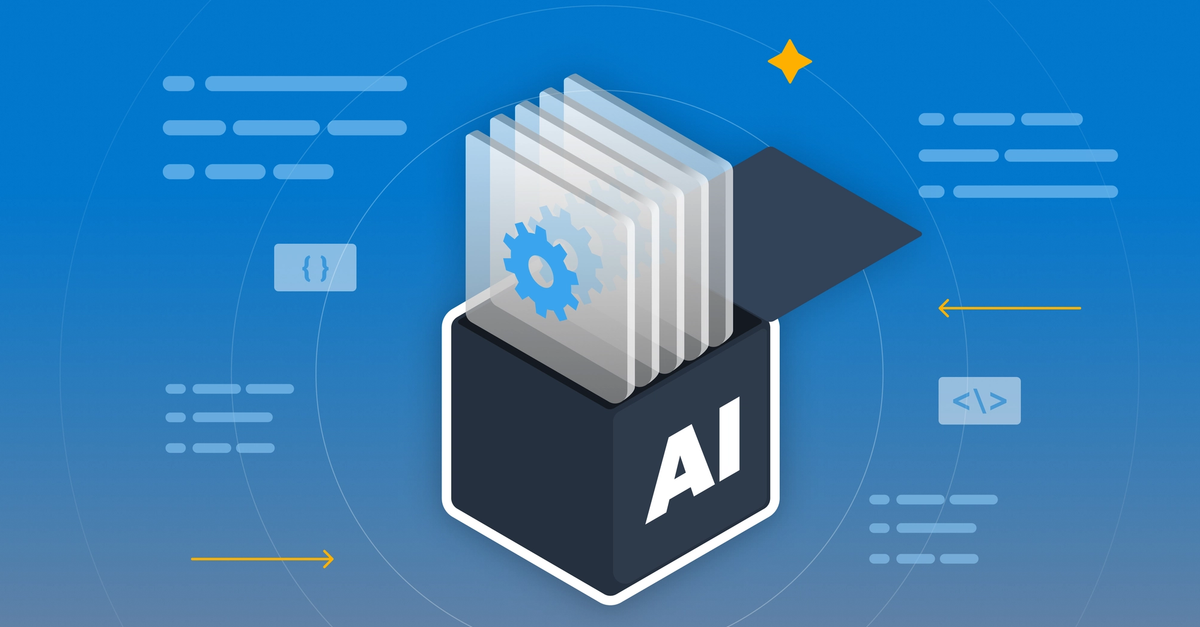
We’ve been exploring what about software development and observability changes with AI, and what doesn’t. Our conclusion: these 5 principles will remain true.
Agentic workloads thrive with precision tooling. Just like developers, they need the rich context, high cardinality, and fast feedback loops that allow them to ask exploratory open-ended questions of their code.
On April 1st, I joined Akshay Utture from Augment Code for a webinar on how AI agents use production feedback to improve code . We covered a lot of ground—the DORA report's findings on AI driving both throughput and instability, why observability is shifting left into the development process,...
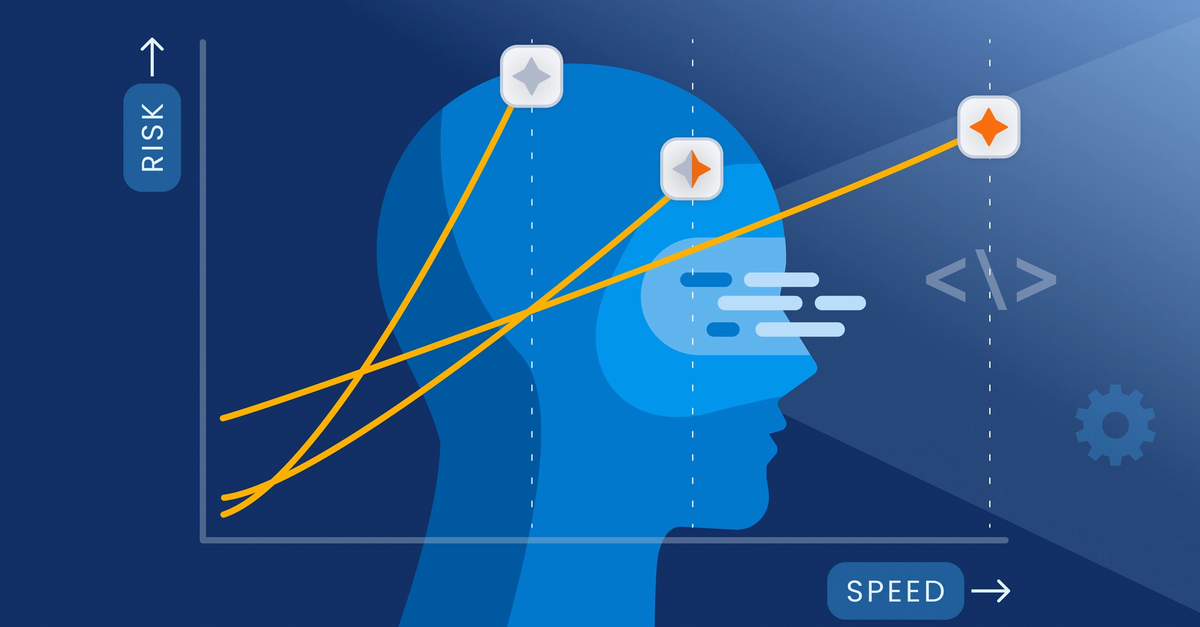
This article introduces a set of theory and practice for adapting to what is one of the most rapid changes to how work is done in arguably any career: AI.
The previous two posts in this series have looked at some of the use cases Honeycomb customers are implementing to observe LLMs in production and power agentic observability workflows. In this third and final post, we’ll take it back to basics and look at how the fundamental capabilities and inf...
In our previous post in our series on observability for the agent era, we looked at how Honeycomb provides unique visibility into LLMs operating in your production environment. Now, let’s flip it around and explore how Honeycomb provides observability insights uniquely suited to helping your AI...
The agent era is here. Engineering teams are shipping AI-powered products, deploying multi-agent systems, and trying to figure out what observability even means for non-deterministic systems.
Honeycomb was excited to attend KubeCon + CloudNativeCon Europe, where one theme stood out across sessions: as AI reshapes how software is built and run, teams are being pushed to rethink how they understand their systems. Without strong observability and feedback loops, AI can accelerate confus...
How Josh Parsons championed observability at Amperity, ran a winning tooling evaluation, and ultimately joined Honeycomb.
Since releasing our hosted MCP server last year, we've been thrilled to see customers not just adopt it but build Honeycomb deeply into their agentic development and observability workflows. Users have embraced it, leveraging Honeycomb to stay in conversation with their code and understand how...

Production is a rowdy place of chaos, especially at scale. When you have millions of requests per second flowing through your system, weird things are always happening.
Most engineering leaders today understand that diversity matters. They've built teams that reflect a range of backgrounds, functions, and experience levels.
In early February, Martin Fowler and the good folks at Thoughtworks sponsored a small, invite-only unconference in Deer Valley, Utah—birthplace of the Agile Manifesto—to talk about how software engineering is changing in the AI-native era. They recently published a summary of key insights a...
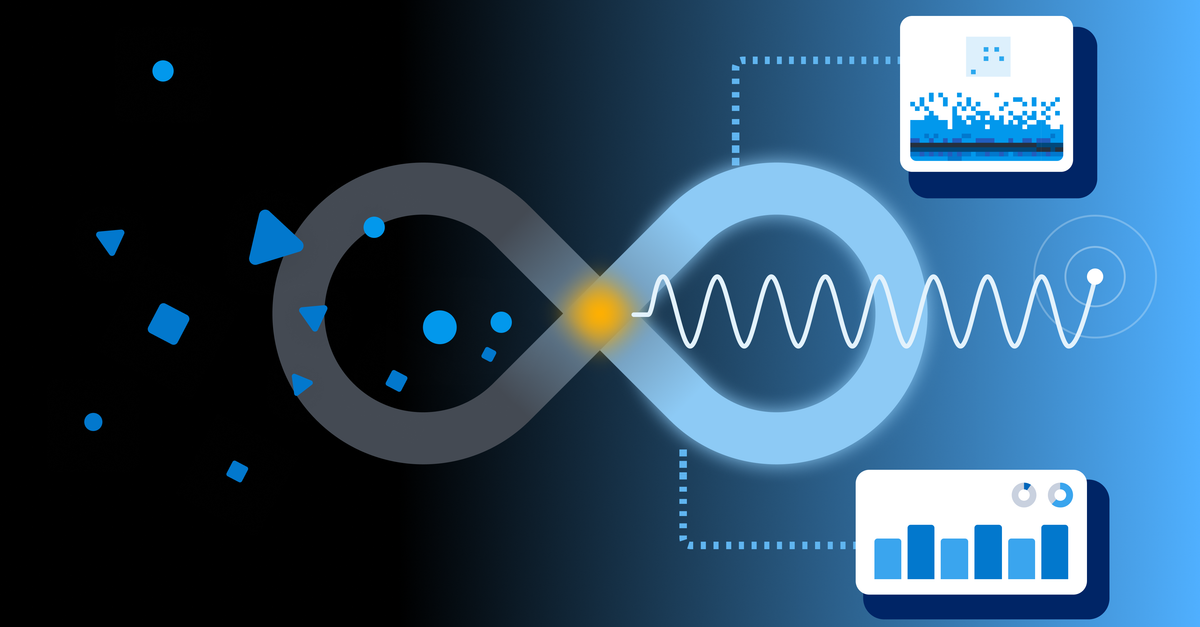
In the shift left era where it feels like we’re pushing everything as far to the start of the SDLC as we can, it may seem counterintuitive to shift anything right. That is, however, exactly what I suggest when it comes to generating metrics.
Every observability vendor has an AI story right now. Most have an MCP .
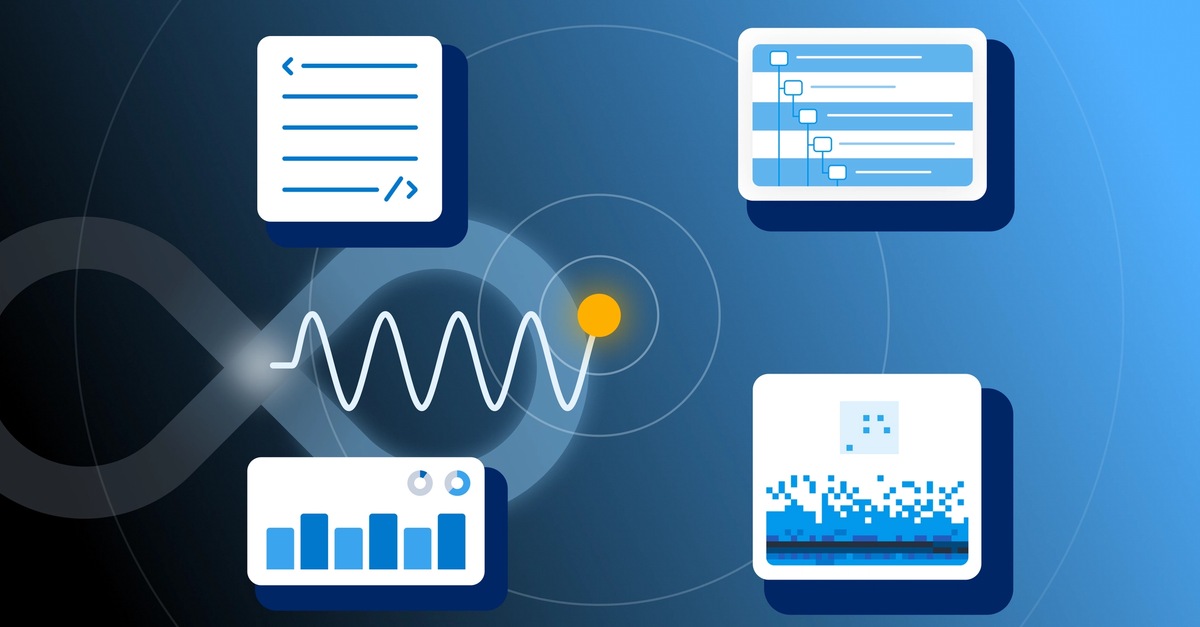
Engineers are constantly context switching between tools, adding cognitive overhead on top of already complex work. You're deep in an investigation, you need to analyze some data, pull up a runbook somewhere else, and share findings back in Slack.
Your software is sending data to Honeycomb. Now where is the dashboard you want?
We recently hosted a webinar on AI-assisted development with DORA , and the audience had a lot of questions—far more than we could get to in an hour. I picked out six that get at the stuff people are wrestling with day to day.
Every year, Honeycomb runs disaster recovery scenarios in multiple environments, including in production. Although each of our instances runs in a single region, on at least three Availability Zones (AZs), we have multiple plans for partial regional failures, and particularly, zonal failures.
Google's Core Web Vitals (CWVs) measurements have been used by web administrators and SREs to review frontend application performance metrics, and have been factored into Google's page rankings since 2021. They are also used in Google Analytics, which crawls websites and evaluates performance me...
What happens when the people who helped define observability take a hard look at AI? That’s what Honeycomb co-founders Christine Yen (CEO) and Charity Majors (CTO) dug into during this webinar, starting with the early days of observability (back when it wasn’t even a category yet).