
Unfortunately, my assistant completely failed just now. There was no crash, there were no errors shown in my terminal; instead, there was this rather silent response. If this had happened to me several weeks back, I wouldn't have any clue whatsoever about how to explain what happened here. However, this time I had a trace open in another tab that showed me precisely what went wrong – a 401 error occurred within a single API call taking almost 510 milliseconds.
This trace is precisely why I am writing this article right now. Three days back, I hadn't even interacted with Docker, OpenTelemetry, or SigNoz yet. As a 2nd year of AI and Data Science student, and for the Agents of SigNoz hackathon, I have decided to develop something beyond mere usage of LLM.
Tools I used:
Streamlit to build the UI, Groq with Llama-3.3-70b-versatile to generate responses, OpenTelemetry to collect and analyze the performance metrics of each request, SigNoz (self-hosted using Foundry) to visualize the traces, costs, and errors, and Docker+WSL2 to run everything on my local Windows machine. I chose Track 01, AI & Agent Observability, since it fit perfectly with what I was trying to accomplish. It wasn't just about invoking the LLM; it was about observing its behavior.
Setting Up SigNoz: My First Real Fight With Docker
I started with SigNoz's own quickstart tool, Foundry, which promised to install SigNoz and get it running with one command. In theory. In practice, I hit a wall before I even got that far.
I was on Windows, which meant Docker needed to run inside WSL2, not directly. Installing WSL2 itself was smooth, but the moment I tried creating a Python virtual environment later on, I got hit with an error about a missing python3-venv package. A quick sudo apt install python3.12-venv fixed it.
Then came my casting.yaml file, the config Foundry uses to deploy SigNoz. My first attempt threw a "mapping values are not allowed in this context" YAML error. I'd been editing it in nano, and at one point accidentally pressed Ctrl+S, which doesn't save in nano. It freezes the terminal instead. Small thing, but it genuinely stumped me for a few minutes.
Once the YAML was fixed and containers were built, docker ps came back empty; the deployment had silently failed to actually start anything, even though the images had downloaded. Running docker compose up -d directly, inside the generated deployment folder, is what finally got all five SigNoz containers up and marked healthy.
Partway through building this, WSL itself crashed with a "Catastrophic failure" error, unrelated to anything I'd actually changed. For a second, it looked like I'd broken something serious. Running wsl --shutdown in PowerShell and reopening Ubuntu fixed it in under a minute, but it was a good reminder that some errors have nothing to do with your own code.
From "It Works" to "I Can See It Work"
Scheduling an API request to Groq and receiving a response wasn't hard; this was just half the work. OpenTelemetry divides the whole operation into traces and spans where a trace describes the complete life cycle of an API request while a span describes each individual action in that life cycle. I applied spans to encapsulate the requests to the Groq API by adding such properties as duration, token count, and the name of the model.
A rough idea about what that looked like in code:
with tracer.start_as_current_span("call_groq_api")as api_span:
response = client.chat.completions.create(
model="llama-3.3-70b-versatile",
messages=st.session_state.messages
)
api_span.set_attribute("llm.tokens.total", response.usage.total_tokens)
It only took a few lines of code to make everything happen on my local instance of SigNoz. It was then that I felt the magic of this challenge really come alive in me, watching those labels come up in the Traces Explorer of SigNoz for the first time as I queried my application.
Observing the Cost of a Single Question
LLM calls always carry some cost, but they are always implicit; you never observe them taking place. I wanted to witness it firsthand.
Groq charges a certain amount for my model per million input and output tokens, $0.59 and $0.79, respectively. As the API itself provides me with the exact number of tokens per response, all I had to do was multiply them by the rate and include the total as a span attribute, llm.cost.usd. Observing a definite figure, such as $0.0004, in the context of the question I have asked, helped me to internalize that "AI calls cost money."
Seeing Something Actually Go Wrong
All that I have done until now has taught me about how everything works. But there was one more question that I wanted to get answered, which is how does something go wrong in SigNoz?
So, I made sure that the API call that I made got encapsulated by a try/except block so that if something went wrong, the failure gets logged onto the span itself, and not cause a crash. I then proceeded to break my own API key.
This failure came up in SigNoz within no time: a span of call_groq_api with a red box around it with "Errors: 1" written on top of it and the status "Error code: 401". The failure took place within 510 milliseconds and I knew exactly why, without any guesswork. This was the point where I understood everything about "If you can't observe your AI agents, you don't own them."
Bringing Everything Together into One Dashboard
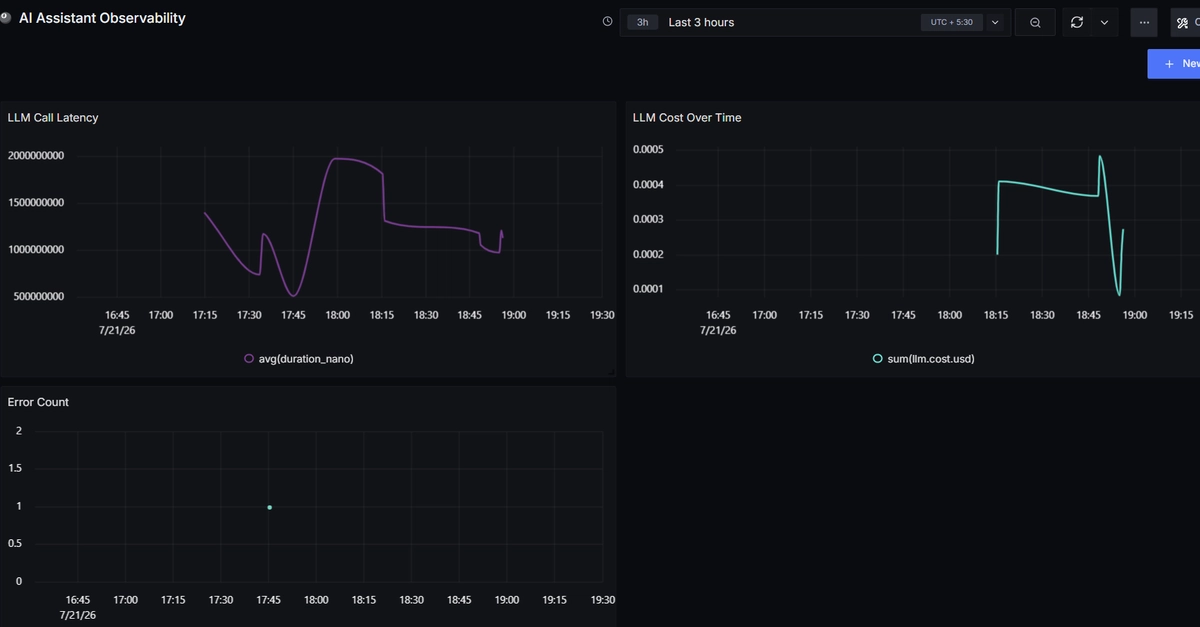
Individual traces were wonderful for drilling down on an individual request, but what I really needed was one dashboard that gave me the broader context: how does this application perform over time?
To accomplish this goal, I created a SigNoz dashboard consisting of three graphs: average latency of LLM calls, cost incurred over time, and the number of failed calls. Connecting the cost graph involved looking for my custom attribute llm.cost.usd because it wasn't a default field in SigNoz; SigNoz had no trouble with it.
It was satisfying to see the number of errors suddenly go up at the same moment when I had messed up my API key before.
What I Learned
To begin with, I thought the AI would provide rather obvious answers which would be inferior to what a model like ChatGPT would provide. But no, Llama-3.3 with its Groq processing came up with coherent and well-reasoned answers.
If there is one piece of advice I can give my past self, it is to not care too much about not knowing the tools beforehand. Docker, OpenTelemetry, and SigNoz I learned entirely during the hackathon itself. It proved to be possible, only not as quick as I hoped for. One thing to remember if you are planning on doing the same: Ctrl+S will not save in nano, it will freeze your terminal. Cost me a good five minutes of confusion.
Conclusion
Just three days ago, I could not have explained to you what a span was. But now, I have an AI assistant with which I know everything there is about what makes the traceable parts of the LLM calls, costs, failures, and every question work. The difference between those two states is, in my opinion, the best thing about this hackathon.
The complete code, including the SigNoz setup configuration, can be found on GitHub at: https://github.com/saheli-roy-commits/ai-agent-observability-signoz
In the interest of transparency: I used Claude to help me learn these tools step by step, debug errors as they came up, and structure this write-up. The mistakes, the decisions, and the actual experience of building this were mine.
0 Comments
Log in to join the conversation.No comments yet. Be the first to share your thoughts.