
Knowing what you're spending on observability is useful. Knowing which team, service, or project is driving that spend is what actually lets you act on that information.
Cost attribution is a core part of how Grafana Cloud approaches cost management and optimization. It gives your organization a clear, structured way to allocate observability spend across teams, projects, and services, turning a single consolidated bill into a meaningful breakdown that builds accountability and supports internal billing models like chargeback and showback.
Grafana Cloud already supported cost attribution for metrics, logs, and traces. More recently, we extended that support to Grafana Cloud Synthetic Monitoring and performance testing with Grafana Cloud k6. This gives you deep visibility into testing costs and a consistent way to attribute spend across both your observability and testing workflows. Whether it's a spike in check executions or a load test that ran longer than planned, you can now trace that cost back to the team or service responsible, the same way you already could for your metrics, logs, and traces.
Cost attribution in Grafana Cloud: how it works
Cost attribution is a feature within Grafana Cloud Cost Management and Billing, a centralized suite of tools to manage, track, and optimize observability spend.
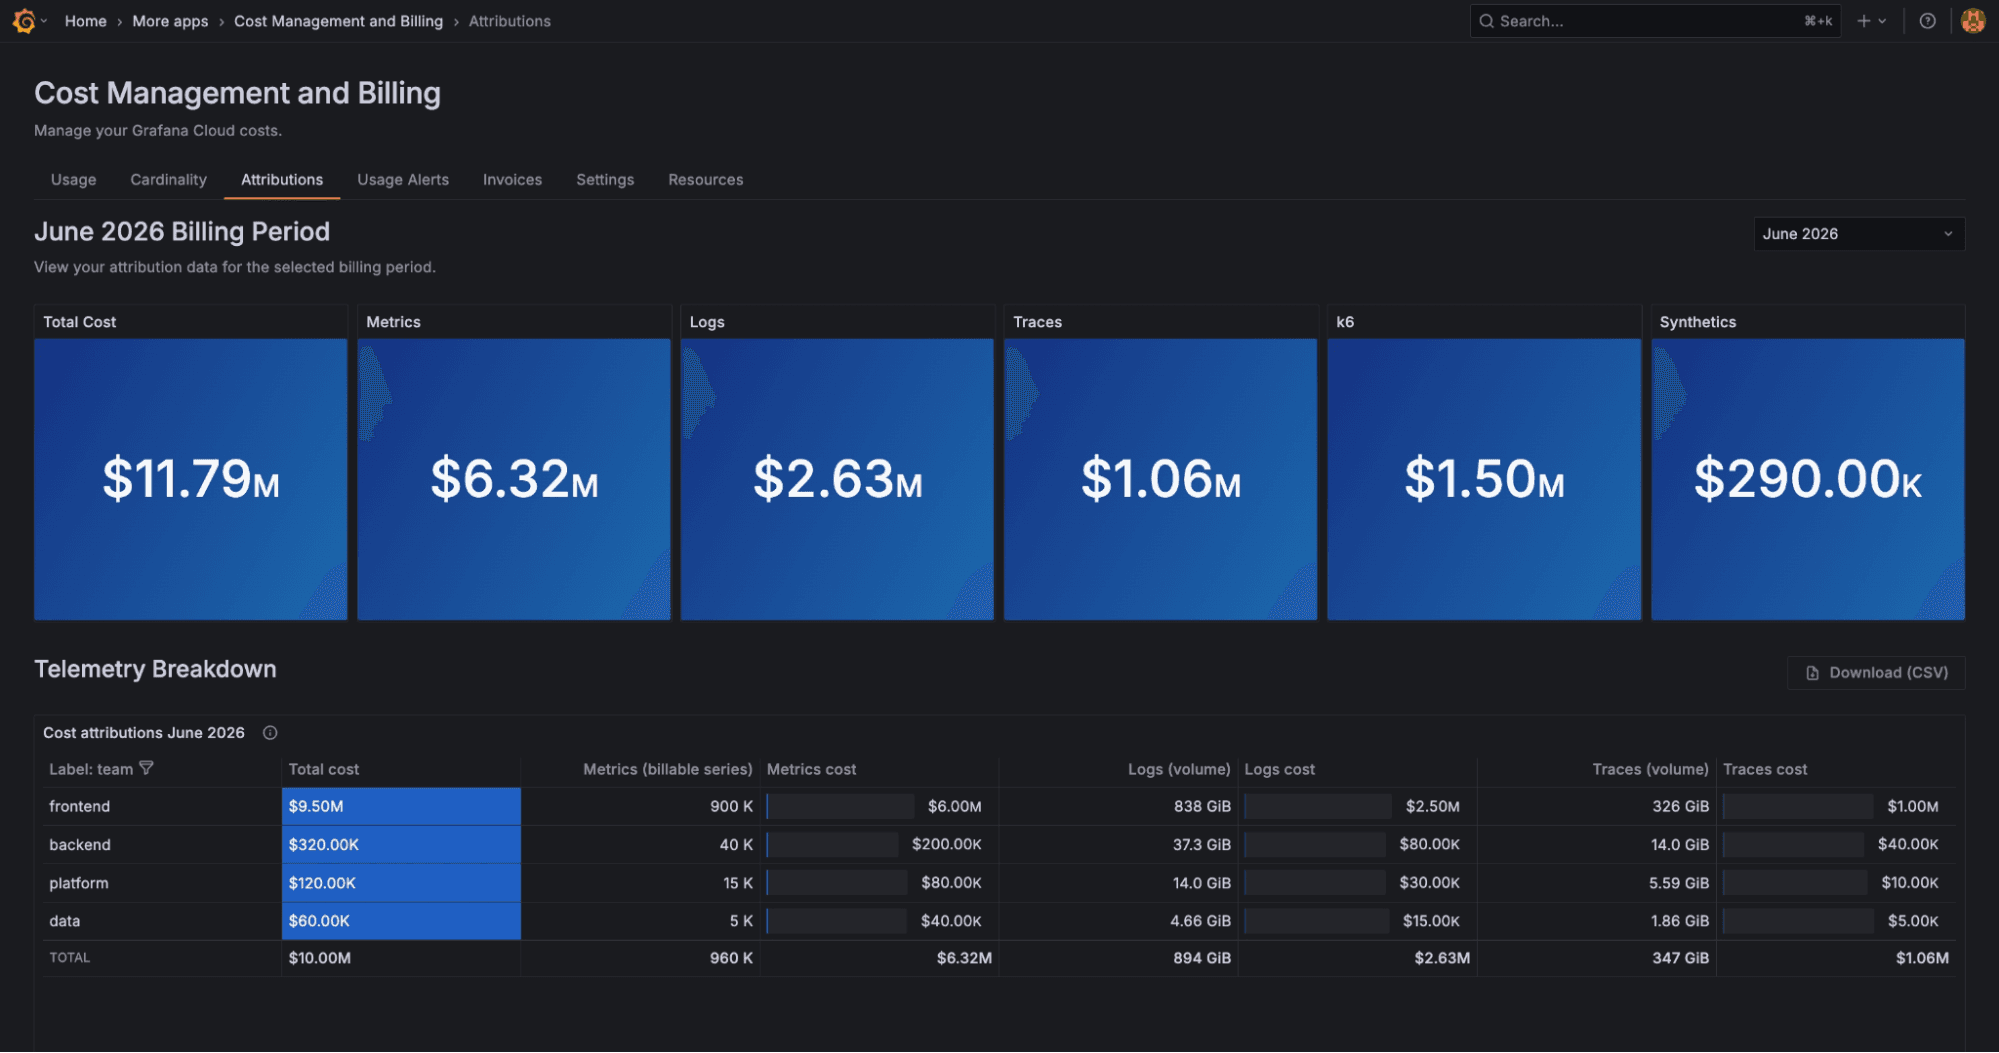
Attribution is label-based; you configure up to two labels, such as team and env, and Grafana Cloud analyzes your telemetry data against those labels.
Usage and costs are calculated for every unique combination of label values, and that data is surfaced directly in the Cost Attribution tab within the Cost Management and Billing app. For a full walkthrough, see the cost attribution documentation.
A few things worth knowing before you get started:
Cost attribution is forward-looking: it begins allocating from the moment you configure it. Historical data prior to setup is not retroactively attributed.
Telemetry that doesn't include your configured labels will appear as unattributed usage, so consistent labeling across your data pipelines matters.
The feature supports up to 1,000 unique label value combinations, giving you meaningful segmentation without unbounded cardinality.
Cost attribution is built for the teams that sit at the intersection of engineering and financial accountability: These include:
Centralized observability teams who manage a shared Grafana Cloud instance and need to distribute costs across internal consumers.
Engineering teams who want visibility into what their services are spending on observability.
FinOps practitioners who need the data to drive cost governance, budgeting, and chargeback processes.
Cost attribution for Grafana Cloud Synthetic Monitoring
Synthetic Monitoring is a black box monitoring solution that lets you proactively assess your systems’ reliability, performance, and correctness by emulating user behavior from global probe locations. Cost attribution for Synthetic Monitoring is based on executions; every run of your checks is counted against the label values so you can reconcile spend internally.
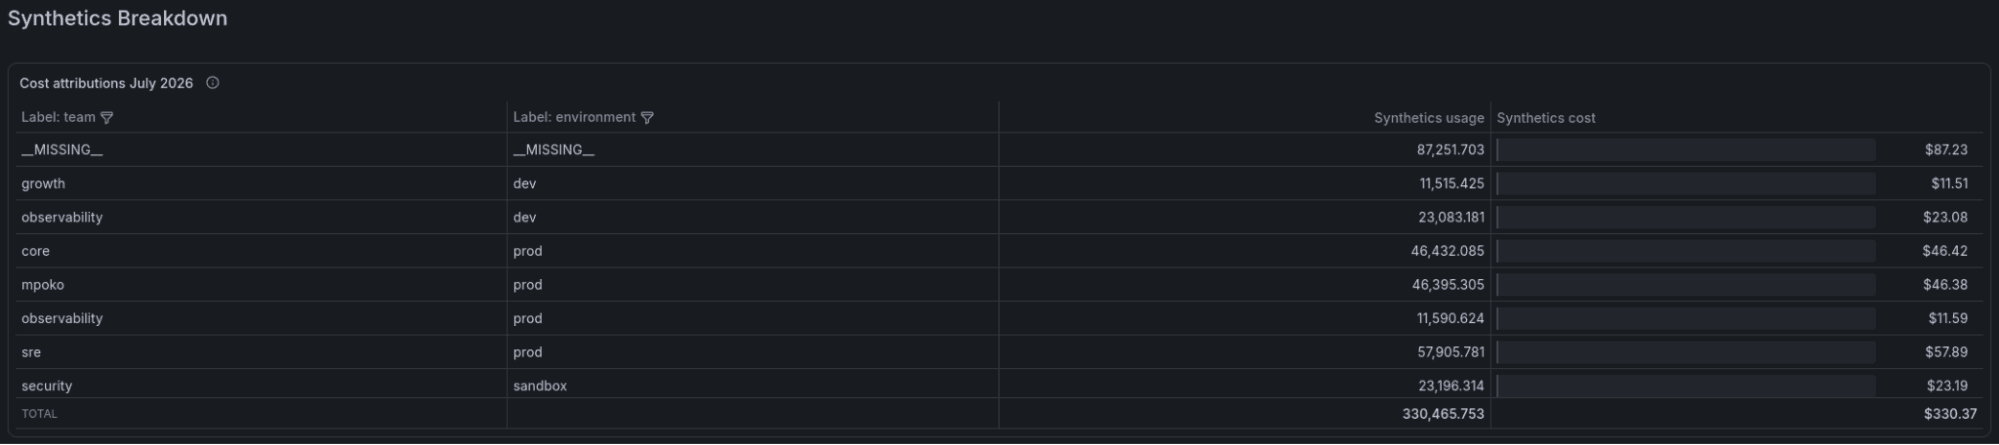
Example organization that configured "team" and "environment" as cost attribution labels.
It will work with existing custom labels you apply to your checks. So if you are already using labels that you would leverage for cost attribution purposes, there’s no new taxonomy to adopt. Once an admin configures the cost attribution label keys (for example, team and service_name), any check already carrying these keys will begin reporting automatically; checks missing these labels can be updated to add them. Checks that are missing either or both configured labels will be clearly visible within the Synthetic Monitoring UI and report as unattributed within the Cost Management and Billing app.
Attribution labels are supported whether you manage checks via Terraform, the API, or within the UI. To learn more, please reference our docs.
Cost attribution for Grafana Cloud k6 performance testing
For Grafana Cloud k6, the fully managed performance testing platform powered by k6 OSS, attribution works by tracking Virtual User Hour (VUH) consumption of each test run. This makes it easier to understand and allocate testing costs across teams, departments, environments, services, or any other dimension that matters to your organization.
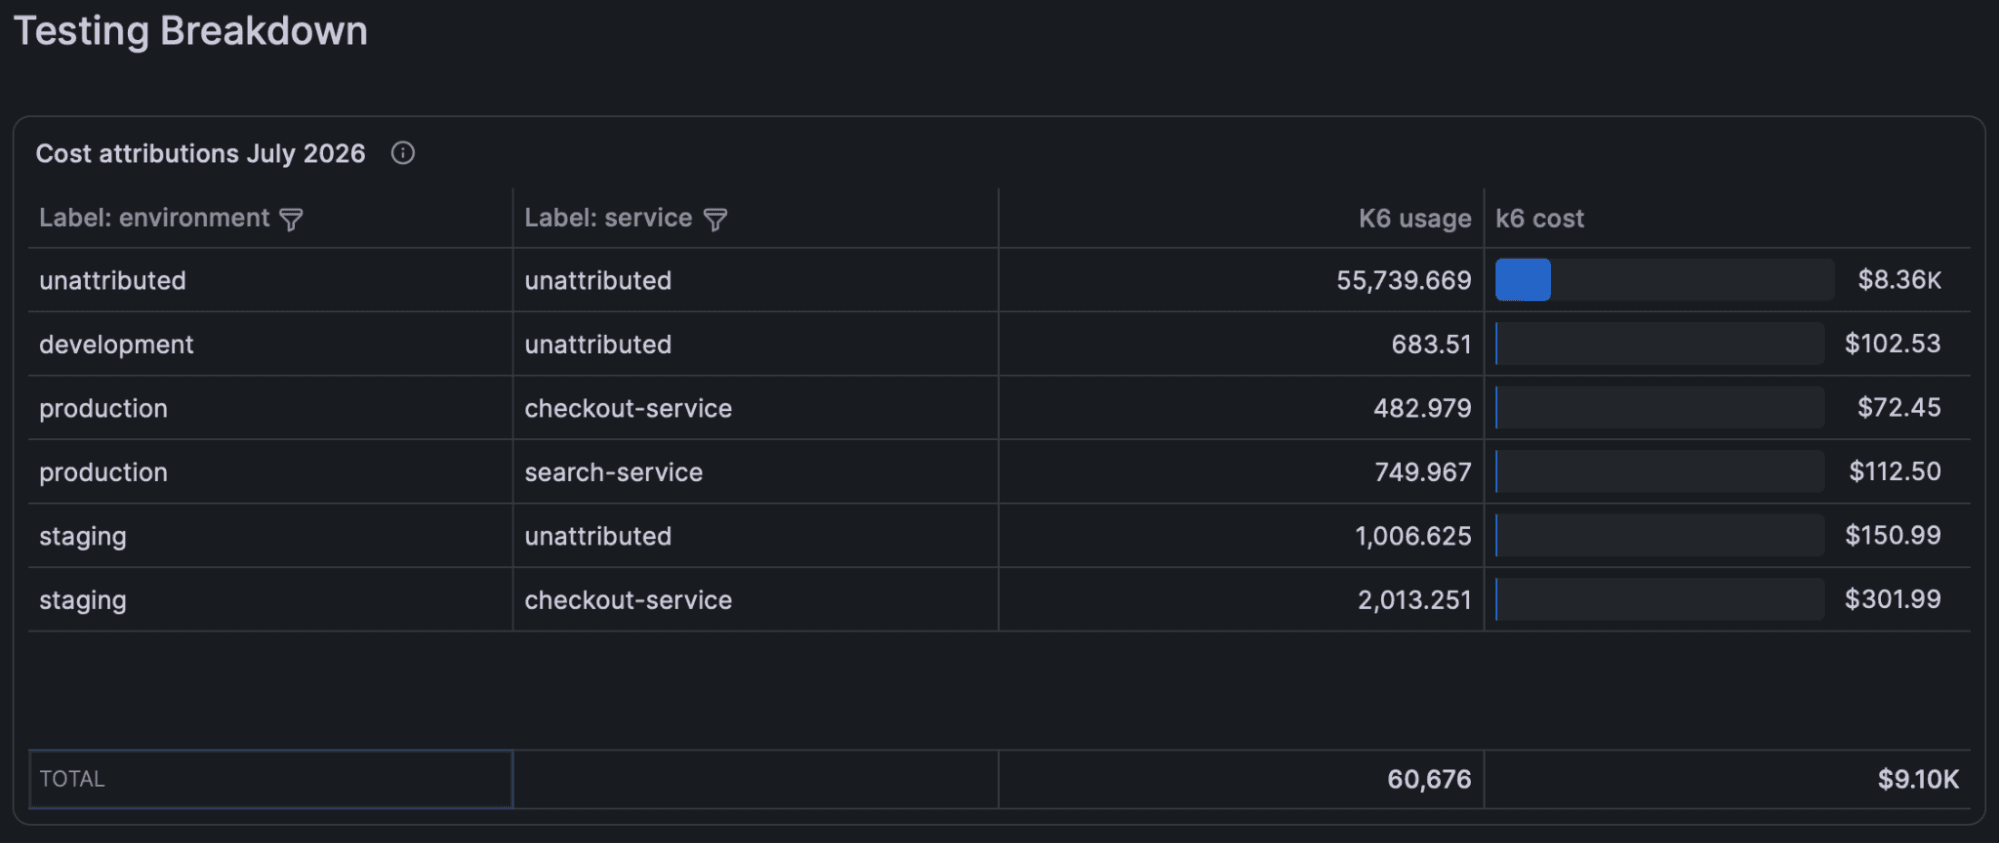
Example organization that configured "environment" and "service" as cost attribution labels.
Labels are created in Grafana Cloud k6 or through the REST API, and are assigned per project. Choose the labels that best fit your projects; for example, if you use one project per environment, environment could be a target label. If you organize your projects by the subsystem under test, subsystem could be the right label for you.
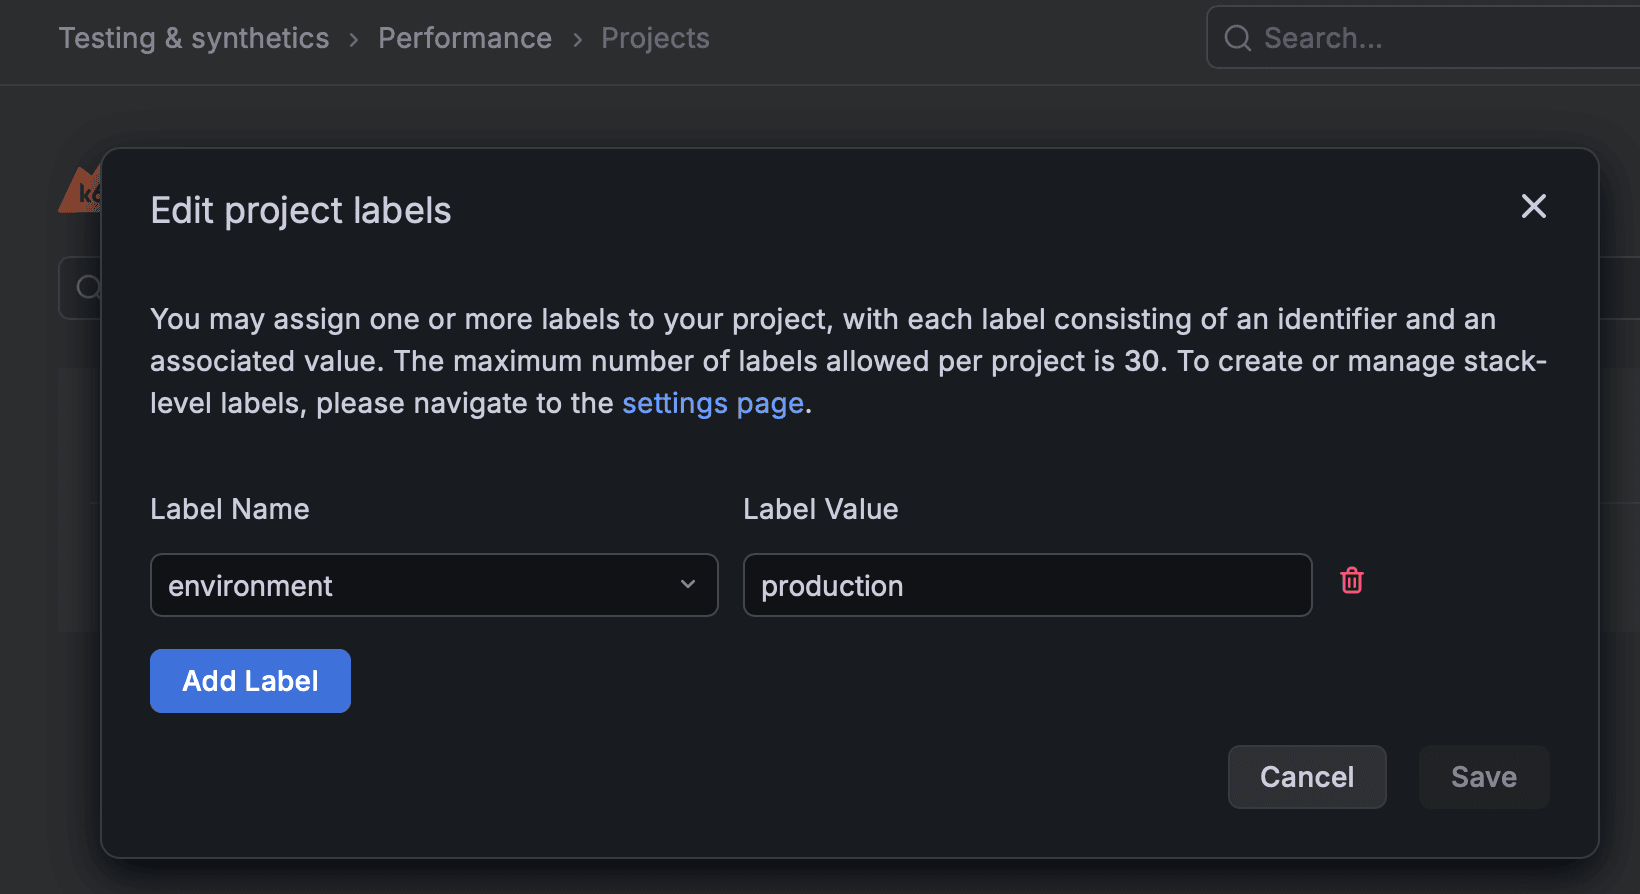
Example project that has a label name "environment" with a "production" value configured.
Once an admin configures the matching keys in Cost Management and Billing, VUH consumption will be reported automatically when future test runs are executed. Projects without the configured labels appear as unattributed. To learn more, visit our docs.
What’s next
Cost attribution across metrics, logs, traces, synthetic monitoring, and performance testing is just the foundation.
For example, we’re also working on usage attribution for Grafana Assistant, the AI-powered agent in Grafana Cloud. You'll be able to see how your Assistant token consumption breaks down by user, including usage within your included range and any overages. This will surface within your existing usage experience, giving you a consistent place to manage both allocation and attribution.
If you're already using Grafana Cloud, cost attribution is available now. Head to the Cost Management and Billing app to configure your attribution labels and start breaking down your spend.
Grafana Cloud is the easiest way to get started with metrics, logs, traces, dashboards, and more. We have a generous forever-free tier and plans for every use case. Sign up for free now!
Tags
0 Comments
Log in to join the conversation.No comments yet. Be the first to share your thoughts.