
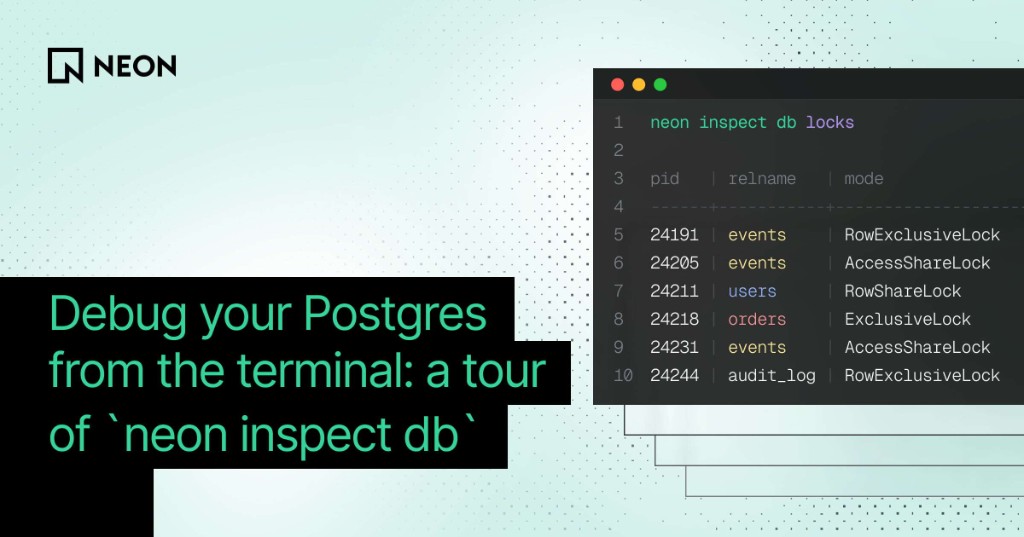
You can now debug your Postgres from the terminal with neon inspect db, a set
of read-only, performance-tuning and observability commands built into the Neon
CLI. Each one runs a single query against Postgres' own statistics and catalog
views and prints a clean table (or JSON/YAML for scripting).
Neon already has tooling for managing your database as a resource. You can script
projects, branches, and endpoints with the Neon API,
do the same in TypeScript with the Neon SDK,
and capture your setup as code with neon.ts and neon link. We recently gave
that API surface a passthrough command, neon api,
so an agent can reach any endpoint the moment it ships. That whole surface
answers control-plane questions: what branches exist, which endpoint is
read-write, what's my connection string.
When something is slow, none of that helps. You want to know what's bloated,
which query is holding a lock, whether your cache-hit rate is falling, or which
index is dead weight. Until now, answering any of those meant leaving the CLI:
open psql, connect, and write a SELECT against pg_stat_activity or
pg_statio_user_tables from memory. Every time.
The friction adds up:
- You re-establish a connection (role, database, SSL, pooler or direct, the right branch) before you can ask anything.
- You recall the exact catalog view, the columns, the joins, and the thresholds, then usually get one wrong on the first try.
Agents can make it worse. Raw SQL access is unreliable and unsafe: models
hallucinate pg_catalog column names, write subtly broken queries, and nothing
stops an arbitrary DROP, a table-locking statement, or an unbounded
SELECT * that dumps a million rows into context. Results have no stable shape
to parse, and the connection string is a credential you would rather an agent
never touch.
neon inspect db closes that gap without asking you to leave the CLI you already
use. If neon api is the complete escape hatch for the control plane, inspect db is its curated, data-plane counterpart: it brings the diagnostics into the
same tool that already knows how to reach your database.
neon inspect db --help

Read-only Postgres diagnostics, one query each.

Commands:
  table-sizes            Total table size, largest first
  index-sizes            Index size, largest first
  bloat                  Estimated table bloat
  unused-indexes         Low-scan removal candidates
  seq-scans              Sequential scans per table
  long-running-queries   Queries running over 5 minutes
  locks                  Locks held, with query and age
  outliers               Queries by total exec time
  calls                  Most frequently called queries
  vacuum-stats           Autovacuum status, dead tuples
  replication-slots      Slot status, client, LSNs, lag
  subscriptions          Logical replication progress
  lfc-hit-rate           Local File Cache hit rate
  working-set            Working set vs LFC size

Options:
  --db-url <url>         Inspect any Postgres directly
  --output table|json|yaml
Connection resolved for you: neon inspect db resolves endpoint, role,
password, and database through the same Neon API the SDK and the rest of the CLI
use. Name a diagnostic; there is no connection string to assemble.
Curated queries, not recall: Fourteen subcommands run known-good, versioned SQL against the right catalog views and return only the columns that answer the question.
Read-only and bounded: Every command observes and reports. There is no write path, columns and rows are scoped, and heavy results are capped.
Extension prerequisites
neon inspect db resolves a connection the same way the rest of the CLI does, so
there are two main ways to point it at a database.
- A linked Neon project. Once the project is linked (or a context is set), the
CLI connects automatically whenever you are in the project folder, and you no
longer need
--db-url:
neon link   # or: neon set-context --project-id <id>
neon inspect db bloat- Most inspection commands are Postgres-agnostic. You can run them against any
Postgres database, even one that is not a Neon project, by providing a
connection string via
--db-url:
neon inspect db bloat \
  --db-url postgres://<user>:<pass>@<host>/<db>
Where is your storage going, and how much of it is waste?
table-sizeslists every table with its total size including TOAST, largest first (schema,name,size).index-sizesdoes the same for indexes (schema,name,size).bloatgives a statistical estimate of table bloat frompg_stats: a ratio and the wasted bytes (type,schema,object_name,bloat,waste), top 25 by waste. It is an estimate, not an exact measurement, so treat it as a signal for where to look.
neon inspect db table-sizes

 schema | name       | size
--------+------------+--------
 public | events     | 4520 MB
 public | users      | 312 MB
 public | audit_log  | 98 MB

neon inspect db index-sizes

 schema | name                | size
--------+---------------------+--------
 public | events_pkey         | 880 MB
 public | events_source_idx   | 210 MB
 public | users_email_key     | 41 MB

neon inspect db bloat

 type  | schema | object_name | bloat | waste
-------+--------+-------------+-------+--------
 table | public | events      | 2.4   | 1200 MB
 table | public | sessions    | 1.8   | 240 MB
 table | public | users       | 1.1   | 18 MB
Find the indexes nothing reads, and the tables Postgres keeps scanning end to end.
unused-indexesflags non-unique, non-primary-key indexes with fewer than 50 scans, ordered by size (table,index,index_size,index_scans). These are your removal candidates: they cost writes and storage but rarely serve a read.seq-scanscounts sequential scans per table, highest first (schema,name,count). A big, growing count on a large table usually means a missing index.
neon inspect db unused-indexes

 table          | index               | index_size | index_scans
----------------+---------------------+------------+-------------
 public.events  | events_source_idx   | 210 MB     | 3
 public.users   | users_nickname_idx  | 44 MB      | 0
Live activity and contention
What is happening right now, and what is stuck behind it?
long-running-queriesshows queries running longer than five minutes (pid,duration,state,query), so a runaway statement is one command away.lockslists locks currently held, with the acquiring query and its age (pid,relname,mode,locktype,granted,age,query). When writes are blocked, this is where you find the culprit.
neon inspect db long-running-queries

 pid   | duration | state  | query
-------+----------+--------+----------------------------------
 24191 | 00:12:47 | active | UPDATE events SET processed = ...
 24188 | 00:07:03 | active | SELECT count(*) FROM audit_log ...

neon inspect db locks

 pid   | relname | mode             | locktype | granted | age      | query
-------+---------+------------------+----------+---------+----------+------------------------
 24191 | events  | RowExclusiveLock | relation | t       | 00:12:47 | UPDATE events SET ...
 24205 | events  | AccessShareLock  | relation | f       | 00:00:19 | SELECT * FROM events ...
Seeing LFCLock?
These two subcommands surface the statements that dominate your database's time
and traffic, both reading from pg_stat_statements. If the extension is not
installed, the command stops with a CREATE EXTENSION pg_stat_statements; hint
instead of a cryptic error.
outliersranks queries by cumulative execution time (total_exec_time,prop_exec_time,ncalls,query), top 25. This is where you find the query that is quietly eating your database.callsranks queries by how often they run (ncalls,total_exec_time,prop_exec_time,query), top 25. A cheap query called a million times can outweigh an expensive one called twice.
neon inspect db outliers

 total_exec_time | prop_exec_time | ncalls  | query
-----------------+----------------+---------+----------------------------------
 3 days 04:11:52 | 61.0%          |  812394 | SELECT * FROM orders WHERE use ...
 22:15:39        | 17.8%          |    1288 | SELECT count(*) FROM events WH ...
 15:02:11        | 12.0%          |   99812 | INSERT INTO audit_log (actor,  ...
 03:14:22        | 2.6%           | 1240112 | SELECT * FROM events WHERE ...
 01:09:47        | 0.9%           |   44201 | UPDATE inventory SET stock = s ...
 00:41:19        | 0.6%           | 4821004 | SELECT 1 FROM sessions WHERE ...

neon inspect db calls

 ncalls  | total_exec_time | prop_exec_time | query
---------+-----------------+----------------+----------------------------------
 4821004 | 00:41:19        | 0.6%           | SELECT 1 FROM sessions WHERE ...
 1240112 | 03:14:22        | 2.6%           | SELECT * FROM events WHERE ...
  812394 | 3 days 04:11:52 | 61.0%          | SELECT * FROM orders WHERE use ...
   99812 | 15:02:11        | 12.0%          | INSERT INTO audit_log (actor,  ...
   44201 | 01:09:47        | 0.9%           | UPDATE inventory SET stock = s ...
    1288 | 22:15:39        | 17.8%          | SELECT count(*) FROM events WH ...
Maintenance
vacuum-stats shows autovacuum health per table: last manual vacuum, last
autovacuum, live row count, dead tuples, and whether Postgres now expects
autovacuum to fire (schema, table, last_vacuum, last_autovacuum,
rowcount, dead_rowcount, expect_autovacuum), ordered by dead tuples. Rising
dead tuples with expect_autovacuum = yes and no recent run points at autovacuum
falling behind.
Vacuum stats reset on auto-suspend
neon inspect db vacuum-stats

 schema | table    | last_vacuum      | last_autovacuum  | rowcount | dead_rowcount | expect_autovacuum
--------+----------+------------------+------------------+----------+---------------+-------------------
 public | events   |                  | 2026-07-14 09:12 | 42000000 | 3100000       | yes
 public | sessions | 2026-07-13 22:01 | 2026-07-14 06:40 | 880000   | 12000         | no
After a logical replication migration, or when running physical replicas, these two show whether replication is keeping up.
replication-slotsreports each slot's kind, status, client, restart and confirmed-flush LSNs, and lag (slot_name,slot_type,slot_kind,status,client_addr,restart_lsn,confirmed_flush_lsn,replication_lag). Lag is recovery-aware, measured frompg_last_wal_receive_lsn()on a standby andpg_current_wal_lsn()otherwise, and falls back torestart_lsnfor physical slots with no confirmed-flush position.slot_kindseparates the subscription's steady-state CDC (apply) slot from the temporary initial-sync (tablesync) slots Postgres creates per table during the first copy (namedpg_<subid>_sync_<relid>), and from physical slots used by streaming replicas.subscriptionsis a subscriber-side subcommand. It shows per-table logical replication progress (subscription,table_name,status,lsn) on a database that has a subscription set up, and prints an empty-set message everywhere else. It pairs withreplication-slots: a table stillcopyinghere has a matchingpg_<subid>_sync_<relid>tablesync slot there, and both clear once the table reachesready.
neon inspect db replication-slots

 slot_name           | slot_type | slot_kind                | status    | client_addr | restart_lsn | confirmed_flush_lsn | replication_lag
---------------------+-----------+--------------------------+-----------+-------------+-------------+---------------------+-----------------
 migrate_slot        | logical   | CDC (apply)              | streaming | 10.0.1.42   | 3F/8A21C0   | 3F/8A44E8           | 148 kB
 pg_16401_sync_16385 | logical   | initial-sync (tablesync) | catchup   | 10.0.1.42   | 3F/8A2200   | 3F/8A2280           | 12 kB
 standby_1           | physical  | physical                 | streaming | 10.0.1.51   | 3F/8A4500   |                     | 0 bytes

neon inspect db subscriptions

 subscription | table_name    | status  | lsn
--------------+---------------+---------+-----------
 upstream_sub | public.events | ready   | 3F/8A44E8
 upstream_sub | public.users  | copying |
On a standalone Postgres, shared_buffers is your cache and its hit rate tells
the story. Neon is a bit different because of our architecture. It pins
shared_buffers at 128 MB regardless of compute size and extends the cache with
a Local File Cache (LFC) that grows to roughly 75% of your compute's RAM. So a
shared_buffers hit rate undercounts what is actually cached on Neon. The number
that matters is the LFC hit rate.
lfc-hit-ratereports the Local File Cache hit rate fromneon_get_lfc_stats()(name,ratio), the effective cache on Neon. Aim for 0.99+ (99%). A falling ratio means your working set is outgrowing the LFC. Note the counters reset on compute restart, so a cold compute reads0until it serves traffic.working-setestimates your working set across the 1m, 5m, 15m, and 1h windows and compares each to the LFC size (window,working_set,lfc_size,exceeds_lfc). Whenexceeds_lfcturns toyes, your hot data no longer fits in cache, the signal to size your compute up.
Both read from the neon extension. Like the pg_stat_statements guard on
outliers and calls, they check for it first and fail with a
CREATE EXTENSION neon; hint.
neon inspect db lfc-hit-rate

 name         | ratio
--------------+-------
 lfc hit rate | 0.995

neon inspect db working-set

 window | working_set | lfc_size | exceeds_lfc
--------+-------------+----------+-------------
 1m     | 512 MB      | 3072 MB  | no
 5m     | 1840 MB     | 3072 MB  | no
 15m    | 3400 MB     | 3072 MB  | yes
 1h     | 4100 MB     | 3072 MB  | yes
Every neon inspect db command is read-only, scoped to the columns that answer
the question, and capped when results get large, which makes it as safe to hand
to an agent as it is to run yourself.
Point it at a linked branch, or at any Postgres with --db-url, and start with
whatever is slow. Read the Neon CLI docs
for the full command reference, and come tell us which diagnostic or CLI
improvements you want next in the Neon Discord.
0 Comments
Log in to join the conversation.No comments yet. Be the first to share your thoughts.