
This is a submission for DEV's Summer Bug Smash: Clear the Lineup powered by Sentry.
Written with AI assistance (Claude). The measurements, negative controls and verification below are real and reproducible — every number was taken from the runs described.
Project Overview
Typst is a markup-based typesetting system written in Rust — think LaTeX, but with a sane language and compile times measured in milliseconds. You write = Heading, it produces a PDF.
The interesting part for this challenge is how Typst handles introspection. Documents can ask questions about their own finished layout: "what page is this heading on?", "how many figures are there?", "give me every <glossary> label". That's circular by nature — the answer depends on the layout, and the layout depends on the answer. Typst resolves it by compiling the document repeatedly (up to 5 times) until the answers stop changing.
When they don't stop changing, Typst has to tell you which lookup failed to settle. That's the step this post is about.
Bug Fix or Performance Improvement
Issue #8611 reports a brutal regression between 0.15.0 and 0.14.2 on a 300-page document:
- Compile time: 1m 17s → 14 minutes
- Peak memory: 32GB → 41GB
The reporter profiled it with Perfetto and found all the time going into a single step called analyze introspections — which is new in 0.15. A Typst maintainer confirmed the shape of it:
"This is actually very interesting because 'analyze introspections' is a new step and it's not supposed to be particularly expensive. So it taking this long is very unexpected."
"There are 11,618,776 individual introspections and, with 0.15, Typst records and analyzes all of these for convergence to give hints. All of this machinery in Typst could probably be optimized… My gut feeling is that maybe there's even some quadratic complexity."
Then it stalled, for a very human reason: the document is confidential and the profile was 13.8GB of JSON. Nobody could reproduce it.
What's actually happening
Reading the code, the cost has three multiplying layers:
// crates/typst-library/src/engine.rs — recording
self.introspections.push(introspection);   // push-only. no dedup.

// crates/typst-library/src/introspection/convergence.rs — analysis
pub fn analyze(...) -> EcoVec<SourceDiagnostic> {
    for introspection in introspections {                    // every single one
        if let Some(warning) = introspection.0.diagnose(world, introspectors) {
            sink.warn(warning);
        }
    }
Enter fullscreen mode Exit fullscreen mode
and diagnose does this:
const INSTANCES: usize = MAX_ITERS + 1;   // = 6

let history = History::compute(world, introspectors, |engine, introspector| {
    self.introspect(engine, introspector)   // re-executed once per instance
});
Enter fullscreen mode Exit fullscreen mode
So every recorded introspection is re-executed 6 times, each time building a fresh Engine, Sink and Traced. With the reporter's 11.6 million introspections, that's roughly 70 million re-executions and 70 million engine allocations — in a step whose only job is producing warning messages.
The bit that stood out: Sink::push_introspection is push-only with no deduplication, yet Introspection already implements PartialEq and Hash (via dyn_eq/dyn_hash). The machinery for collapsing duplicates was already there and unused.
Are there actually duplicates?
That's the whole question, and it isn't obvious. Look at what the introspection types carry:
| Type | Fields | Can duplicate? |
|---|---|---|
CounterAtIntrospection |
(Counter, Location, Span) |
❌ Location is per-element |
PositionIntrospection |
(Location, Span) |
❌ |
QueryIntrospection |
(Selector, Span) |
✅ no Location
|
QueryFirstIntrospection |
(Selector, Span) |
✅ |
StateFinalIntrospection |
(State, Span) |
✅ |
BibliographyIntrospection |
(Span) |
✅ |
A Span is a source code location, not a document location. So a query() inside a loop has one span for every iteration — twenty thousand iterations produce twenty thousand byte-identical introspections. That's precisely the glossary pattern the reporter described: one helper function, called once per entry.
I couldn't get their document. But I didn't need it — I could build the condition myself.
Code
PR: Analyze each distinct introspection only once →
The change is small:
let mut sink = Sink::new();

// Analyze each distinct introspection only once. Equal introspections
// observe the same data, so they have equal histories and produce equal
// diagnostics. A document that issues the same query or state lookup from
// one call site records that introspection once per execution, and each
// analysis re-runs it once per iteration, so the duplicates dominate.
let mut seen = FxHashSet::default();
for introspection in introspections {
    if !seen.insert(introspection) {
        continue;
    }
    if let Some(warning) = introspection.0.diagnose(world, introspectors) {
        sink.warn(warning);
    }
}
Enter fullscreen mode Exit fullscreen mode
Plus impl Eq for Introspection {}, because only PartialEq existed.
This PR deliberately lives on a fork. Typst's CONTRIBUTING.md states that contributions implemented with AI assistance will not be accepted, and I'm not going to spend a volunteer maintainer's limited time arguing with their own stated policy. The measurement stands on its own; if it's useful to them, the analysis is public.
My Improvements
Building the reproduction
analyze only runs when convergence validation fails, so a benchmark needs a document that genuinely can't settle, plus a lot of introspections. Two knobs:
#let headings = 400      // makes each individual query expensive
#let n = 60000           // introspection volume, all from one span

// non-convergence driver: this state depends on its own resolved value
#let osc = state("osc", 0)
#context osc.update(osc.final() + 1)

#for i in range(headings) [ = Heading #i ]

#for _ in range(n) [ #context { let _ = query(heading) } ]
#for _ in range(n) [ #context { let _ = osc.final() } ]
Enter fullscreen mode Exit fullscreen mode
Measuring it properly — after getting it wrong
My first attempt reported analyze introspections: 0.00s across 0 spans, which I nearly believed. Two things were wrong: Typst's trace emits ph:"B"/ph:"E" pairs, not ph:"X" spans with a dur field, so my parser counted nothing — and the span wasn't in the trace at all.
So I stopped trusting the tracer and instrumented the function directly:
PROBE analyze: 40001 introspections, 3 distinct, elapsed 61.99ms
Enter fullscreen mode Exit fullscreen mode
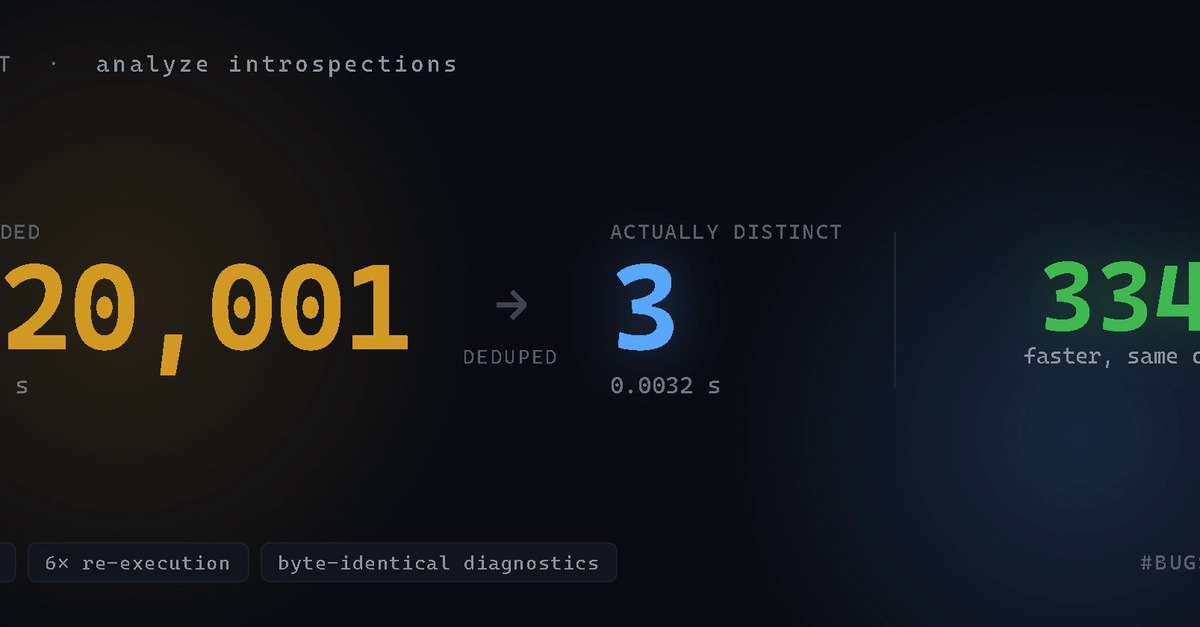
40,001 recorded, 3 distinct. A 13,334× duplication factor, measured rather than assumed.
Before and after
Same binary, both code paths behind one env toggle so a single build produced both numbers:
| introspections analysed | analyze introspections |
wall clock | |
|---|---|---|---|
| Upstream | 120,001 | 1.078 s | 2.63 s |
| Deduped | 3 | 0.0032 s | 1.44 s |
~334× on the step. ~1.8× end to end.
Proving it didn't break anything
A perf win that changes output is not a win.
Diagnostics byte-identical. diff clean over all 34 lines — including the see 2 additional warnings count. I'd worried dedup would change that count; it doesn't, because Typst already runs deduplicate() on diagnostics downstream. Duplicate warnings were being computed and then thrown away.
PDF content identical. All outputs exactly 162,464 bytes. Raw hashes differ, which looked alarming until I ran the control: two consecutive baseline runs also differ from each other. The differing bytes are the timestamp:
region A: /ModDate(D:20260726232403+08'00)/CreationDate(D:20260726232403+08'00)
region C: /ModDate(D:20260726232407+08'00)/CreationDate(D:20260726232407+08'00)
Enter fullscreen mode Exit fullscreen mode
92 bytes differ baseline-vs-baseline; 88 baseline-vs-deduped. Same region, same magnitude. Pre-existing non-determinism.
Test suite neutral. 1555 passed, 2167 failed — identical with and without the patch. Those 2167 failures are environmental, not mine: tests/src/run.rs:520 calls std::os::windows::fs::symlink_file(...).unwrap(), which returns Windows error 1314 (ERROR_PRIVILEGE_NOT_HELD) without Developer Mode. I confirmed it by stashing the patch and getting the same count. It fails array-basic-syntax, which has nothing to do with introspection.
cargo fmt --check and cargo clippy --workspace --all-targets both clean.
The design decision I'd defend
Deduplication belongs in analyze, not at record time in Sink::push_introspection. It's tempting to dedupe at the source — but push_introspection runs on every compile, while analyze only runs when a document fails to converge. Deduping at the record site would tax every successful compile in order to speed up the failure path. Wrong layer.
What I'd want a reviewer to push back on
Being straight about the limits:
This is my synthetic document, not theirs. My per-introspection cost is ~1.55µs; their queries run over 300 pages and are far heavier. The total saving is duplication_factor × per_introspection_cost. I've proven the mechanism and that the factor can be enormous — I have not proven how much of their specific 10.9× this recovers, and I'm not going to claim otherwise.
Location-carrying introspections can't collapse. If their 11.6 million are mostly CounterAtIntrospection, this helps far less. The evidence that it won't be is their own description — a glossary whose entries reference each other, which hits QueryIntrospection and StateFinalIntrospection, neither of which carries a Location.
What I took away
A push-only collection plus an expensive per-item operation is a latent multiplier. Nobody wrote a quadratic loop here. Someone added a recording buffer, someone else added a 6× analysis, and the bug is the product of two individually reasonable decisions.
Verify the benchmark before trusting the benchmark. My first measurement said zero. If I'd reported that, I'd have concluded there was nothing to optimise — in a step that was in fact burning a full second.
Run the control. The PDFs differed and my instinct was that I'd broken something. Two baseline runs differing from each other took thirty seconds to check and saved me chasing a phantom.
Submitted for DEV's Summer Bug Smash — Clear the Lineup.
0 Comments
Log in to join the conversation.No comments yet. Be the first to share your thoughts.