
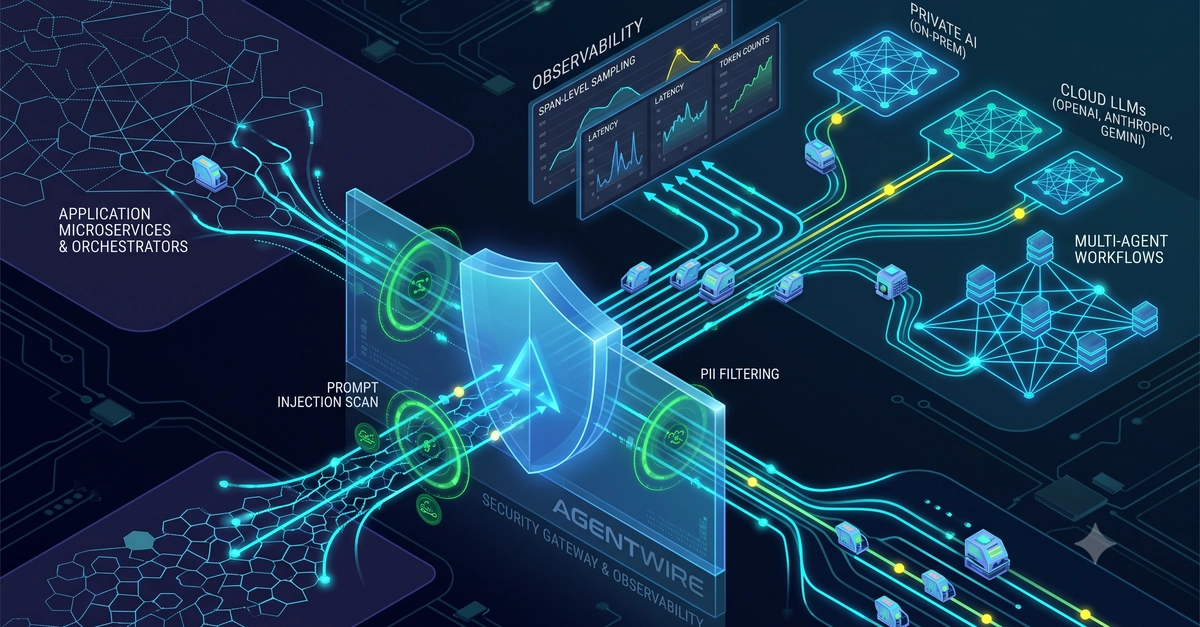
Every team building with AI agents eventually hits the same wall: the moment a request leaves your application and enters the world of LLMs, tool calls, and MCP servers, it disappears into a black box. You can see the final answer, but not the packet trail that produced it — which model actually answered, how many tokens it burned, how long each hop took, or whether something in that chain quietly leaked a secret or got hijacked by a prompt injection.
That's the gap AgentWire is built to close.
What it is
AgentWire is an open-source observability, security, and cost-analytics layer for AI agents, LLMs, and MCP servers. The project's own tagline sums up the ambition well: OpenTelemetry + Wireshark + Cloudflare for AI agents. In practice, that means one system doing three jobs that today live in three different toolchains:
- Observability — trace every hop between a user, an agent, an LLM, and any MCP servers it calls, the way OpenTelemetry does for microservices.
- Security — inspect that same traffic for prompt injection, secret leakage, and malicious patterns, the way an edge gateway inspects HTTP traffic.
- Cost intelligence — attribute a dollar figure to every packet, broken down by agent, model, and provider, so "why did our OpenAI bill triple" has an actual answer.
It's built on ASP.NET Core, licensed Apache 2.0, and designed from the start as an event-driven system rather than a simple logging wrapper — because agentic traffic doesn't arrive as tidy request/response pairs, it arrives as a high-throughput stream of packets that need to be ingested, enriched, and queried without blocking the agent itself.
Where the project stands today
AgentWire is honest about being an active MVP rather than a finished platform, and the README draws a clear line between what's real today and what's on the roadmap:
Available now:
- Trace ingestion via
POST /v1/traces - Packet inspection via
GET /v1/packets - Cost rollups via
GET /v1/analytics/costs - An optional Next.js dashboard scaffold
Planned:
- A YARP-based gateway with collector microservices
- ClickHouse as the analytical store for packet-scale data
- A prompt injection scanner and a full replay engine
- A multi-tenant, enterprise-ready edition
That's a deliberately narrow MVP: get a local ingestion API and cost endpoints working on SQLite first, prove the data model, then grow into the full event-driven architecture.
Examples: getting a trace flowing
1. Clone and run the API
With the .NET 10 SDK installed:
git clone https://github.com/qmmughal/AgentWire.git
cd AgentWire
dotnet run --project src/AgentWire.Presentation
Enter fullscreen mode Exit fullscreen mode
The API comes up on localhost:5102.
2. Send a trace
Every time an agent talks to an LLM, you send AgentWire a packet describing that exchange — which agent, which provider and model, the prompt, the response, and the token/latency numbers:
curl -X POST http://localhost:5102/v1/traces \
  -H "Content-Type: application/json" \
  -d '{
    "traceId": "demo-001",
    "agentId": "support-bot",
    "modelProvider": "openai",
    "modelName": "gpt-4o-mini",
    "systemPrompt": "You are a helpful assistant.",
    "userPrompt": "Hello",
    "llmResponse": "Hi there!",
    "promptTokens": 12,
    "completionTokens": 8,
    "latencyMs": 220
  }'
Enter fullscreen mode Exit fullscreen mode
Ingestion is asynchronous by design, so the call returns immediately with an acknowledgement while the packet is enriched and stored in the background:
{
  "status": "accepted",
  "traceId": "demo-001"
}
Enter fullscreen mode Exit fullscreen mode
3. Inspect the packet
Pull the packet back to see what AgentWire recorded and enriched:
curl http://localhost:5102/v1/packets
Enter fullscreen mode Exit fullscreen mode
[
  {
    "traceId": "demo-001",
    "packetId": "pk_9f2c1a",
    "agentId": "support-bot",
    "modelProvider": "openai",
    "modelName": "gpt-4o-mini",
    "promptTokens": 12,
    "completionTokens": 8,
    "latencyMs": 220,
    "cost": 0.0000042,
    "timestamp": "2026-07-26T10:15:03Z"
  }
]
Enter fullscreen mode Exit fullscreen mode
(Field names and exact values will track whatever the schema looks like by the time you run it — this is illustrative of the shape, not a frozen contract.)
4. Roll it up into cost
The same packet feeds the cost-analytics endpoint, so you can see spend sliced by agent, model, or provider instead of digging through a provider dashboard:
curl http://localhost:5102/v1/analytics/costs
Enter fullscreen mode Exit fullscreen mode
{
  "totalCost": 0.0000042,
  "byAgent": {
    "support-bot": 0.0000042
  },
  "byModel": {
    "gpt-4o-mini": 0.0000042
  }
}
Enter fullscreen mode Exit fullscreen mode
5. Optional — dashboard and local infra
If you'd rather look at a UI than curl JSON:
cd src/Client/dashboard
npm install
npm run dev
Enter fullscreen mode Exit fullscreen mode
That opens a Next.js dashboard on localhost:3000 against the API above.
And if you want to start poking at the pieces the full architecture will eventually run on — Postgres, Redis, RabbitMQ, ClickHouse — they're all wired into a Compose file:
docker compose -f deploy/docker-compose.yml up -d
Enter fullscreen mode Exit fullscreen mode
App container builds aren't wired up yet, so dotnet run stays the way to run the API itself for now.
Where it's headed architecturally
The target architecture is a proper event-driven pipeline: a YARP-based API gateway takes in traffic from agents, SDKs, and OpenTelemetry exporters; a stateless Traffic Collector validates and pushes packets onto a message broker (RabbitMQ/MassTransit) to absorb spikes; a Traffic Analyzer consumes that queue, enriches the data, and batch-writes into storage; and a parallel Security Scanner and Cost Engine run over the same stream without adding latency to the agent's actual request path.
Storage is deliberately polyglot — PostgreSQL for relational metadata like organizations, projects, and agents, with row-level security for tenant isolation; ClickHouse for the high-volume, time-series packet data that needs fast aggregation; and Redis for configuration and rate-limit caching. SDKs for .NET, Python, and JavaScript wrap standard OpenTelemetry SDKs, and a plugin system lets providers (OpenAI, Anthropic) and MCP servers plug in their own cost calculations and security rules.
The business model, up front
The MVP — ingestion, packets, and cost rollups — stays free and open source; that's a deliberate bet that the same organic trust a project like the maintainer's own ckeditor5-blazor built up over years is worth more long-term than gating the basics. The parts of the roadmap that are genuinely expensive to run well — the ClickHouse analytics store, the security scanner, multi-tenant SaaS operations — are earmarked for an eventual hosted, managed tier. There's no beta or waitlist yet; that's a future announcement, not a present pitch.
Why this matters
Most of the AI observability tooling available today was built for a world where an LLM call was the whole story. Agentic systems break that assumption — a single user request can now fan out into a dozen tool calls, several LLM round-trips, and one or more MCP server hops, each with its own latency, cost, and attack surface. AgentWire is a bet that this traffic deserves the same category of tooling that network engineers have had for decades: something you can point at the wire, watch the packets go by, and trust to tell you the truth about what actually happened.
It's early — alpha, by the project's own description — but the direction is clear, and the repository is open for anyone who wants to try it, file an issue, or contribute against the sketched-out MVP epics.
Repo: github.com/qmmughal/AgentWire
License: Apache 2.0
0 Comments
Log in to join the conversation.No comments yet. Be the first to share your thoughts.