
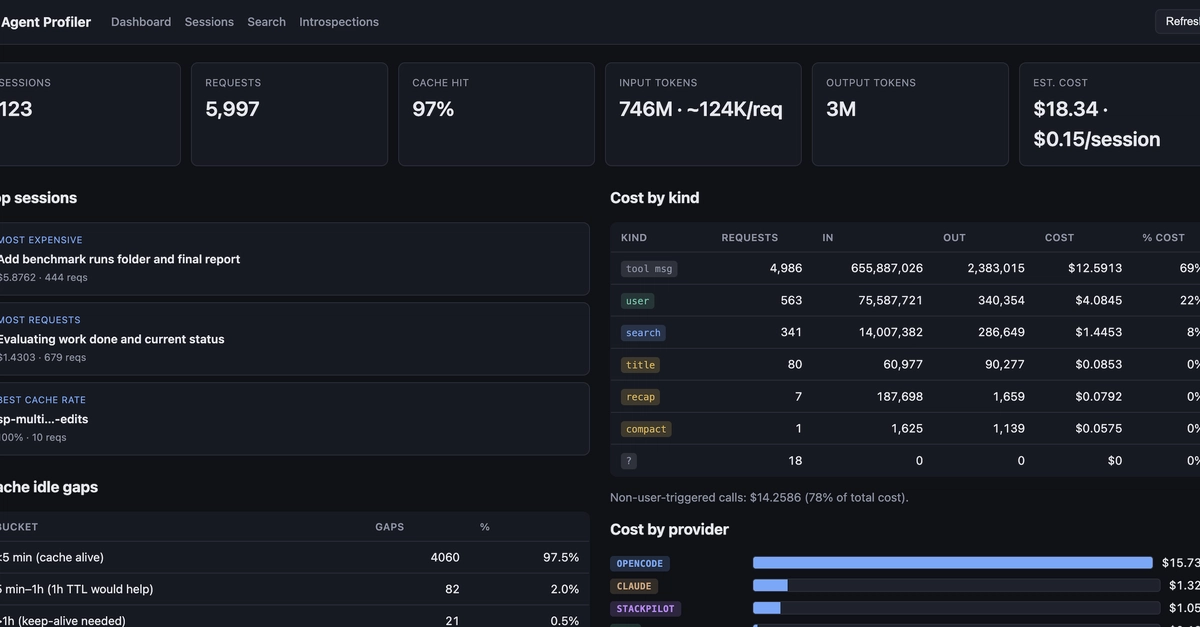


I built a local-first profiler that sits as a transparent reverse proxy between your coding agent (Claude Code, OpenCode) and the LLM provider, recording every request without adding latency. It's like perf for your agent — showing you exactly where your tokens go.
Live demo (read-only dashboard with sample data).
What it surfaced after profiling my own sessions
Only ~60% of my API cost was my actual prompts. The rest was agent overhead I never saw — subagent exploration (
search), context compaction, catch-up summaries when I stepped away, and session-title generation. The profiler classifies every request into 11 kinds (main,search,compact,recap,title,subagent,webfetch,quota,tool_result,guide,unknown) and shows a "Cost by kind" table. Thesearchsubagent alone ate ~25-30% of tokens when I told the agent "explore thoroughly."The 5-minute cache TTL penalty is real and expensive. Claude Code places
cache_control: {"type": "ephemeral"}markers without an explicit TTL — so your cached prefix (system prompt, tools, message history) expires after ~5 minutes of inactivity. Step away to read docs or grab coffee, come back, and the next request pays a full cache write on potentially 200K+ tokens. On Opus models, a cache write is a massive multiplier on your first request back. The profiler detects cold regenerations, marks them with severity badges, and shows exactly what each idle gap cost you.Long sessions compound it. Every turn grows the cached prefix, so cold-refresh costs grow linearly. A 3-hour session can re-write 200K+ tokens on each expiry. The profiler tracks context growth over time and flags when tool definitions alone account for 10-15K tokens re-sent on every call.
I tried to optimize and mostly failed. I built a full optimization layer (pruning stale tool results, collapsing system prompts, removing unused tools) and benchmarked it. Early numbers looked spectacular — but they were wrong. Cross-session cache warming inflated baselines, and the cost model initially ignored cache-write tokens. Once both were fixed, savings vanished. Editing the cached prefix turns cheap reads into expensive writes, and the client re-sends the pristine full history every turn anyway. I wrote up the autopsy in the repo under docs/optimization/FINDINGS.md.
How to try it
npm install -g ai-agent-profiler
aap install              # seeds config
aap serve                # terminal 1: proxy + dashboard at :8080/ui
aap run claude           # terminal 2: launch Claude Code through the proxy
Enter fullscreen mode Exit fullscreen mode
Supports Anthropic, OpenAI, DeepSeek, AWS Bedrock (SigV4), and Ollama. Zero telemetry, secrets redacted. All metrics rebuildable from raw traces.
Repo: https://github.com/rguiu/ai-agent-profiler
I'd love feedback on
- What profiling blind spots am I missing? What can't you answer about your agent today?
- Has anyone tried proxy-level optimization and hit different economics? Did I miss a trick, or is the provider cache truly near-optimal for how agents send requests?
- Does knowing ~40% of your API bill is non-user overhead change how you configure subagents or tool briefs?
- Is anyone else bothered by the 5-minute cache TTL? What practical TTL do you observe in the wild?
- Shell hooks vs structured output — are AI-native tools with token-efficient structured output the right fix, or is output filtering good enough?
0 Comments
Log in to join the conversation.No comments yet. Be the first to share your thoughts.