
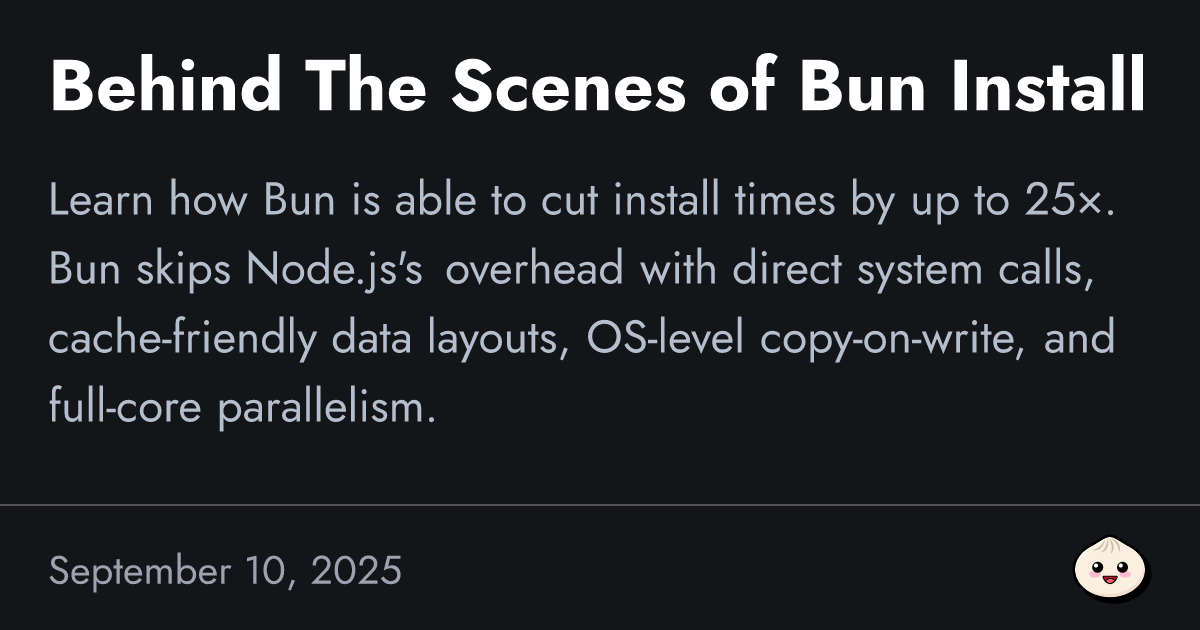
Running bun install is fast, very fast. On average, it runs ~7× faster than npm, ~4× faster than pnpm, and ~17× faster than yarn. The difference is especially noticeable in large codebases. What used to take minutes now takes (milli)seconds.
These aren't just cherry-picked benchmarks. Bun is fast because it treats package installation as a systems programming problem, not a JavaScript problem.
In this post we’ll explore what that means: from minimizing syscalls and caching manifests as binary, to optimizing tarball extraction, leveraging OS-native file copying, and scaling across CPU cores.
But to understand why this matters, we first have to take a small step back in time.
It's the year 2009. You're installing jQuery from a .zip file, your iPhone 3GS has 256MB of RAM. GitHub was just a year old, SSDs cost $700 for 256GB. Your laptop's 5400RPM hard drive maxes out at 100MB/s, and "broadband" means 10 Mbps (if you're lucky).
But more importantly: Node.js just launched! Ryan Dahl is on stage explaining why servers spend most of their time waiting.
In 2009, a typical disk seek takes 10ms, a database query 50–200ms, and an HTTP request to an external API 300ms+. During each of these transactions, traditional servers would just... wait. Your server would start reading a file, and then just freeze for 10ms.

Now multiply that by thousands of concurrent connections each doing multiple I/O operations. Servers spent ~95% of their time waiting for I/O operations.
Node.js figured that JavaScript's event loop (originally designed for browser events) was perfect for server I/O. When code makes an async request, the I/O happens in the background while the main thread immediately moves to the next task. Once complete, a callback gets queued for execution.
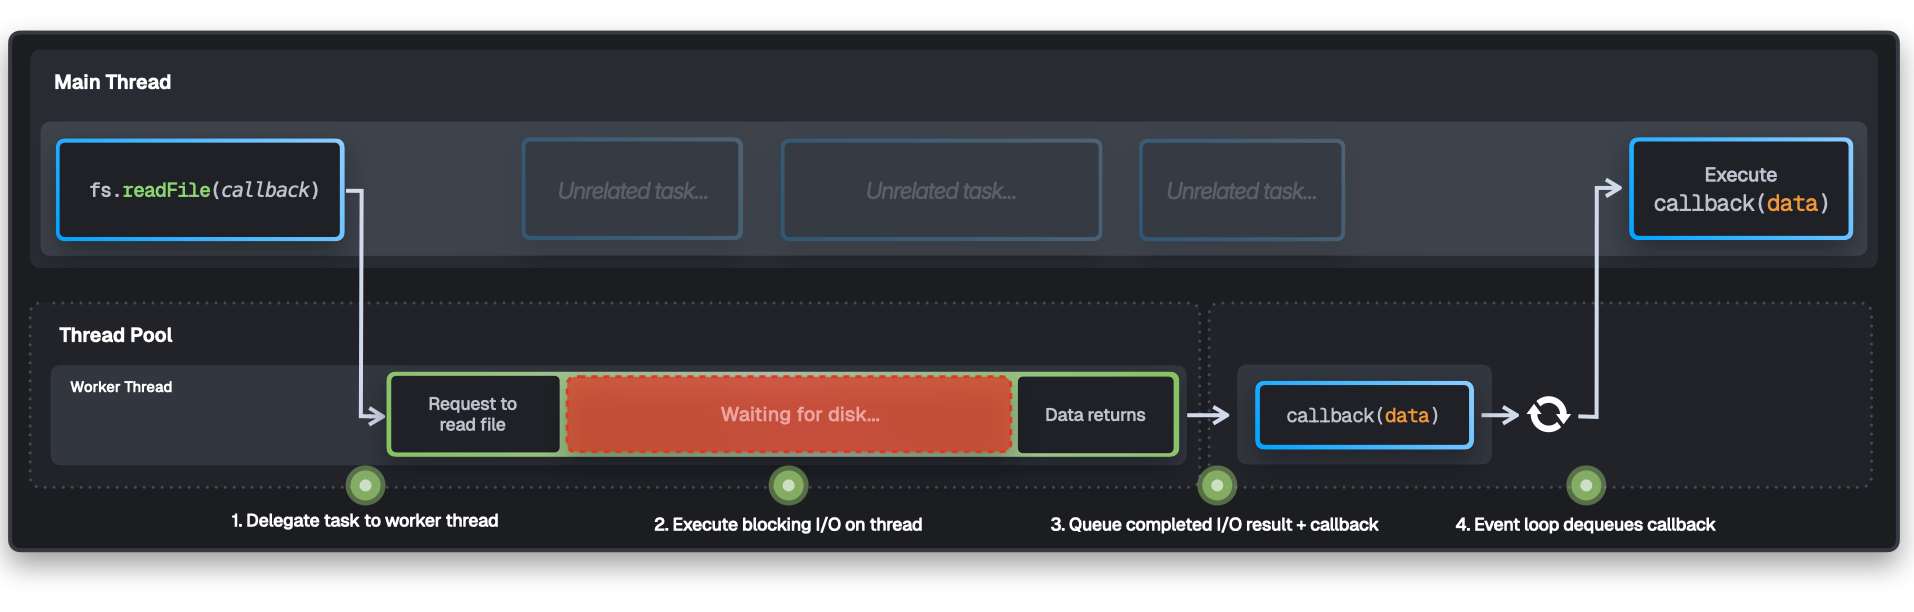
JavaScript's event loop was a great solution for a world where waiting for data was the primary bottleneck.
For the next 15 years, Node's architecture shaped how we built tools. Package managers inherited Node's thread pool, event loop, async patterns; optimizations that made sense when disk seeks took 10ms.
But hardware evolved. It's not 2009 anymore, we're 16 years into the future, as hard as that is to believe. The M4 Max MacBook I'm using to write this would've ranked among the 50 fastest supercomputers on Earth in 2009. Today's NVMe drives push 7,000 MB/s, 70× faster than what Node.js was designed for! The slow mechanical drives are gone, internet speeds stream 4K video, and even low-end smartphones have more RAM than high-end servers had in 2009.
Yet today's package managers still optimize for the last decade's problems. In 2025, the real bottleneck isn't I/O anymore. It's system calls.
The Problem with System Calls
Every time your program wants the operating system to do something (read a file, open a network connection, allocate memory), it makes a system call. Each time you make a system call, the CPU has to perform a mode switch.
Your CPU can run programs in two modes:
user mode, where your application code runs. Programs inuser modecannot directly access your device's hardware, physical memory addresses, etc. This isolation prevents programs from interfering with each other or crashing the system.kernel mode, where the operating system's kernel runs. The kernel is the core component of the OS that manages resources like scheduling processes to use the CPU, handling memory, and hardware like disks or network devices. Only the kernel and device drivers operate inkernel mode!
When you want to open a file, (e.g. fs.readFile()) in your program, the CPU running in user mode cannot directly read from disk. It first has to switch to kernel mode.
During this mode switch, the CPU stops executing your program → saves all its state → switches into kernel mode → performs the operation → then switches back to user mode.
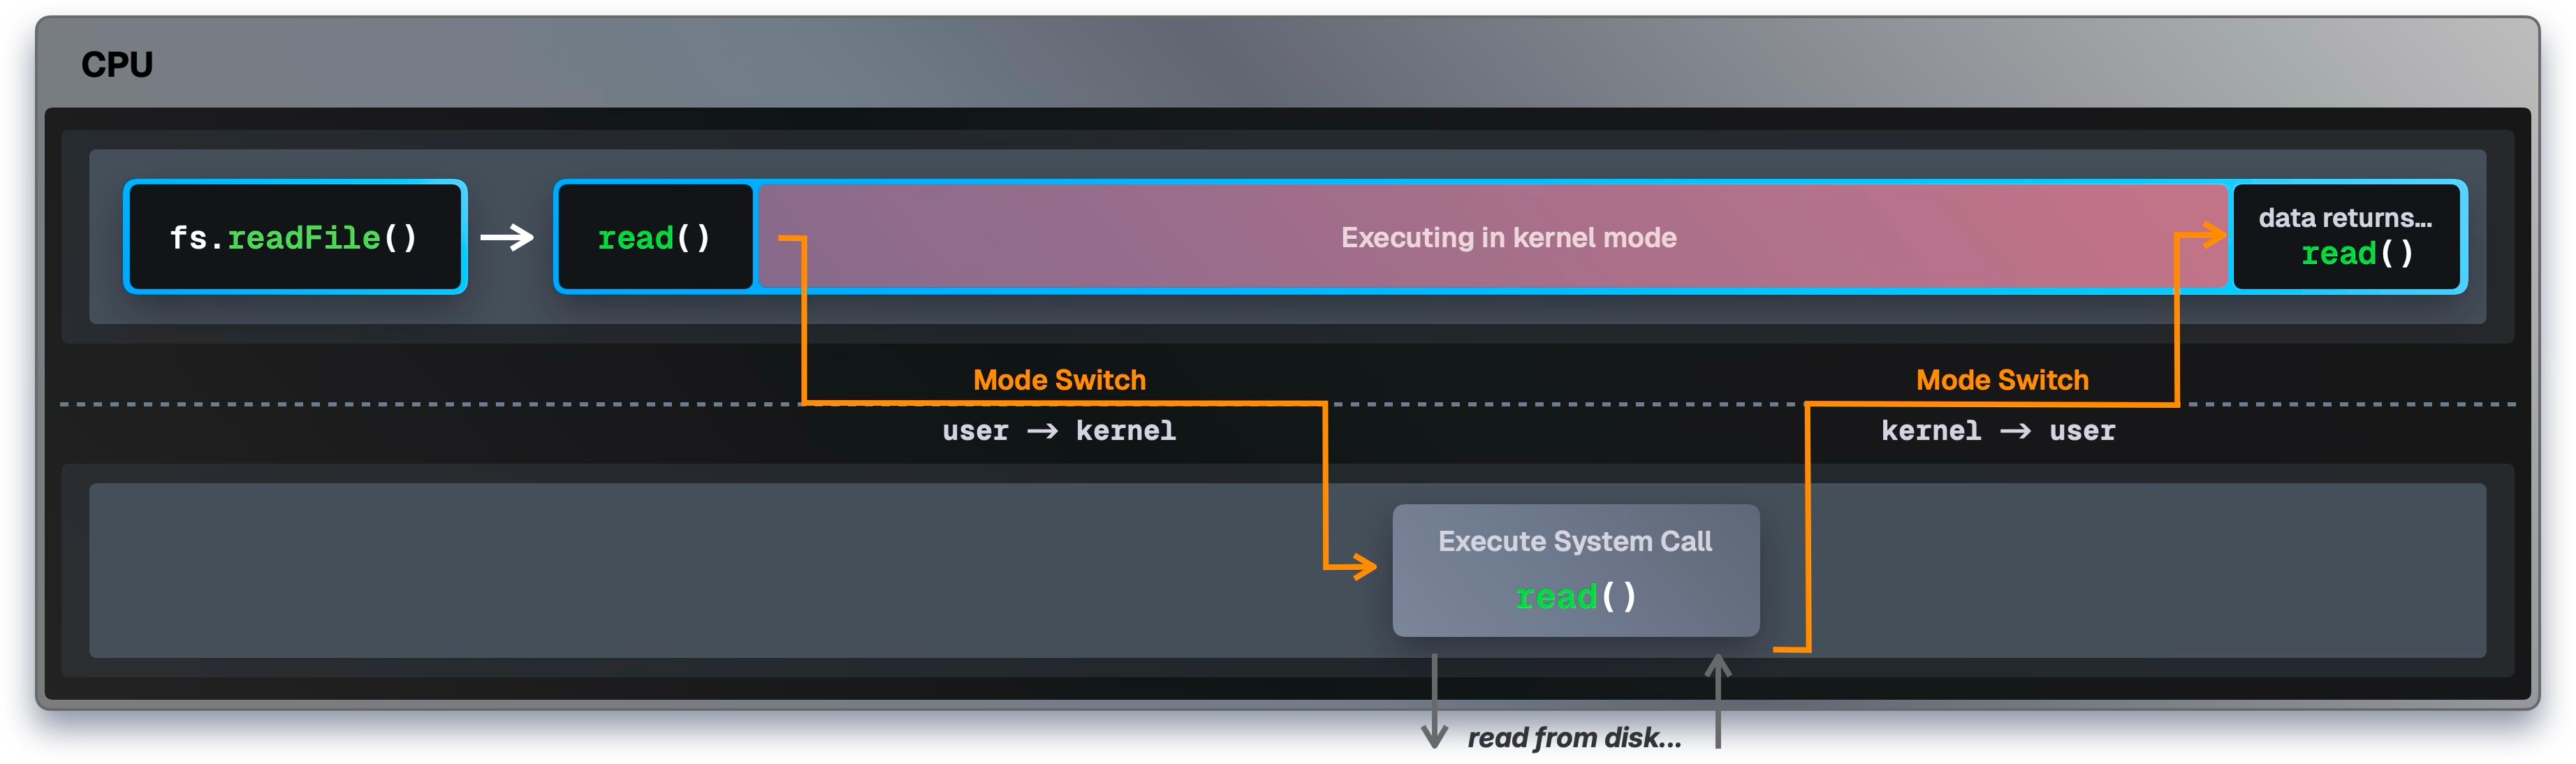
However, this mode switching is expensive! Just this switch alone costs 1000-1500 CPU cycles in pure overhead, before any actual work happens.
Your CPU operates on a clock that ticks billions of times per second. A 3GHz processor completes 3 billion cycles per second. During each cycle the CPU can execute instructions: add numbers, move data, make comparisons, etc. Each cycle takes 0.33ns.
On a 3GHz processor, 1000-1500 cycles is about 500 nanoseconds. This might sound negligibly fast, but modern SSDs can handle over 1 million operations per second. If each operation requires a system call, you're burning 1.5 billion cycles per second just on mode switching.
Package installation makes thousands of these system calls. Installing React and its dependencies might trigger 50,000+ system calls: that's seconds of CPU time lost to mode switching alone! Not even reading files or installing packages, just switching between user and kernel mode.
This is why Bun treats package installation as a systems programming problem. Fast install speeds come from minimizing system calls and leveraging every OS-specific optimization available.
You can see the difference when we trace the actual system calls made by each package manager:
Benchmark 1: strace -c -f npm install
    Time (mean ± σ):  37.245 s ±  2.134 s [User: 8.432 s, System: 4.821 s]
    Range (min … max):   34.891 s … 41.203 s    10 runs

    System calls: 996,978 total (108,775 errors)
    Top syscalls: futex (663,158),  write (109,412), epoll_pwait (54,496)

  Benchmark 2: strace -c -f bun install
    Time (mean ± σ):      5.612 s ±  0.287 s [User: 2.134 s, System: 1.892 s]
    Range (min … max):    5.238 s …  6.102 s    10 runs

    System calls: 165,743 total (3,131 errors)
    Top syscalls: openat(45,348), futex (762), epoll_pwait2 (298)

  Benchmark 3: strace -c -f yarn install
    Time (mean ± σ):     94.156 s ±  3.821 s    [User: 12.734 s, System: 7.234 s]
    Range (min … max):   89.432 s … 98.912 s    10 runs

    System calls: 4,046,507 total (420,131 errors)
    Top syscalls: futex (2,499,660), epoll_pwait (326,351), write (287,543)

  Benchmark 4: strace -c -f pnpm install
    Time (mean ± σ):     24.521 s ±  1.287 s    [User: 5.821 s, System: 3.912 s]
    Range (min … max):   22.834 s … 26.743 s    10 runs

    System calls: 456,930 total (32,351 errors)
    Top syscalls: futex (116,577), openat(89,234), epoll_pwait (12,705)

  Summary
    'strace -c -f bun install' ran
      4.37 ± 0.28 times faster than 'strace -c -f pnpm install'
      6.64 ± 0.51 times faster than 'strace -c -f npm install'
     16.78 ± 1.12 times faster than 'strace -c -f yarn install'

  System Call Efficiency:
    - bun:  165,743 syscalls (29.5k syscalls/s)
    - pnpm: 456,930 syscalls (18.6k syscalls/s)
    - npm:  996,978 syscalls (26.8k syscalls/s)
    - yarn: 4,046,507 syscalls (43.0k syscalls/s)
We can see that Bun installs much faster, but it also makes far fewer system calls. For a simple install, yarn makes over 4 million system calls, npm almost 1 million, pnpm close to 500k, and bun 165k.
At 1000-1500 cycles per call, yarn's 4 million system calls means it's spending billions of CPU cycles just on mode switching. On a 3GHz processor, that's seconds of pure overhead!
And it's not just the amount of system calls. Look at those futex calls! Bun made 762 futex calls (only 0.46% of total system calls), whereas npm made 663,158 (66.51%), yarn made 2,499,660 (61.76%), and pnpm made 116,577 (25.51%).
futex (fast userspace mutex) is a Linux system call used for thread synchronization. Threads are smaller units of a program that run simultaneously that often share access to memory or resources, so they must coordinate to avoid conflicts.
Most of the time, threads coordinate using fast atomic CPU instructions in user mode. There's no need to switch to kernel mode, so it's very efficient!
But if a thread tries to acquire a lock that's already taken, it makes a futex syscall to ask the kernel to put it to sleep until the lock becomes available. A high number of futex calls is an indicator that many threads are waiting on one another, causing delays.
So what's Bun doing differently here?
Eliminating JavaScript overhead
npm, pnpm and yarn are all written in Node.js. In Node.js, system calls aren’t made directly: when you call fs.readFile(), you’re actually going through several layers before reaching the OS.
Node.js uses libuv, a C library that abstracts platform differences and manages async I/O through a thread pool.
The result is that when Node.js has to read a single file, it triggers a pretty complex pipeline. For a simple fs.readFile('package.json', ...):
- JavaScript validates arguments and converts strings from UTF-16 to UTF-8 for libuv's C APIs. This briefly blocks the main thread before any I/O even starts.
- libuv queues the request for one of 4 worker threads. If all threads are busy, your request waits.
- A worker thread picks up the request, opens the file descriptor, and makes the actual
read()system call. - The kernel switches to
kernel mode, fetches the data from disk, and returns it to the worker thread. - The worker pushes the file data back to the main thread through the event loop, which eventually schedules and runs your callback.
Every single fs.readFile() call goes through this pipeline. Package installation involves reading thousands of package.json files: scanning directories, processing dependency metadata, and so on. Each time threads coordinate (e.g., when accessing the task queue or signaling back to the event loop), a futex system call can be used to manage locks or waits.
The overhead of making thousands of these system calls can take longer than the actual data movement itself!
Bun does it differently. Bun is written in Zig, a programming language that compiles to native code with direct system call access:
// Direct system call, no JavaScript overhead
var file = bun.sys.File.from(try bun.sys.openatA(
    bun.FD.cwd(),
    abs,
    bun.O.RDONLY,
    0,
).unwrap());
When Bun reads a file:
- Zig code directly invokes the system call (e.g.,
openat()) - The kernel immediately executes the system call and returns data
That's it. There's no JavaScript engine, thread pools, event loops or marshaling between different runtime layers. Just native code making direct system calls to the kernel.
The performance difference speaks for itself:
| Runtime | Version | Files/Second | Performance |
|---|---|---|---|
| Bun | v1.2.20 | 146,057 | |
| Node.js | v24.5.0 | 66,576 | 2.2x slower |
| Node.js | v22.18.0 | 64,631 | 2.3x slower |
In this benchmark, Bun processes 146,057 package.json files per second, while Node.js v24.5.0 manages 66,576 and v22.18.0 handles 64,631. That's over 2x faster!
Bun's 0.019ms per file represents the actual I/O cost, so how long it takes to read data when you make direct system calls without any runtime overhead. Node.js takes 0.065ms for the same operation. Package managers written in Node.js are "stuck" with Node's abstractions; they use the thread pool whether they need it or not. But they pay this cost on every file operation.
Bun's package manager is more like a native application that happens to understand JavaScript packages, not a JavaScript application trying to do systems programming.
Even though Bun isn't written in Node.js, you can use bun install in any Node.js project without switching runtimes. Bun's package manager respects your existing Node.js setup and tooling, you just get faster installs!
But at this point we haven't even started installing packages yet. Let's see the optimizations Bun applies to the actual installation.
When you type bun install, Bun first figures out what you're asking it to do. It reads any flags you've passed, and finds your package.json to read your dependencies.
Async DNS Resolution
⚠️ Note: This optimization is specific to macOS
Working with dependencies means working with network requests, and network requests require DNS resolution to convert domain names like registry.npmjs.org into IP addresses.
As Bun is parsing the package.json, it already starts to prefetch the DNS lookups. This means network resolution begins even before dependency analysis is even complete.
For a Node.js-based package managers, one way to do it is by using dns.lookup(). While this looks async from JavaScript's perspective, it's actually implemented as a blocking getaddrinfo() call under the hood, running on libuv's thread pool. It still blocks a thread, just not the main thread.
As a nice optimization, Bun takes a different approach on macOS by making it truly asynchronous at the system level. Bun uses Apple's "hidden" async DNS API (getaddrinfo_async_start()), which isn't part of the POSIX standard, but it allows bun to make DNS requests that run completely asynchronously using mach ports, Apple's inter-process communication system.
While DNS resolution happens in the background, Bun can continue processing other operations like file I/O, network requests, or dependency resolution without any thread blocking. By the time it needs to download React, the DNS lookup is already done.
It's a small optimization (and not benchmarked), but it shows Bun's attention to detail: optimize at every layer!
Binary Manifest Caching
Now that Bun has established a connection to the npm registry, it needs the package manifests.
A manifest is a JSON file containing all versions, dependencies, and metadata for each package. For popular packages like React with 100+ versions, these manifests can be several megabytes!
A typical manifest can look something like this:
{
  "name": "lodash",
  "versions": {
    "4.17.20": {
      "name": "lodash",
      "version": "4.17.20",
      "description": "Lodash modular utilities.",
      "license": "MIT",
      "repository": {
        "type": "git",
        "url": "git+https://github.com/lodash/lodash.git"
      },
      "homepage": "https://lodash.com/"
    },
    "4.17.21": {
      "name": "lodash",
      "version": "4.17.21",
      "description": "Lodash modular utilities.",
      "license": "MIT",
      "repository": {
        "type": "git",
        "url": "git+https://github.com/lodash/lodash.git"
      },
      "homepage": "https://lodash.com/"
    }
    // ... 100+ more versions, nearly identical
  }
}
Most package managers cache these manifests as JSON files in their cache directories. When you run npm install again, instead of downloading the manifest, they read it from the cache.
That all makes sense, but the issue is that on every install (even if it's cached), they still need to parse the JSON file. This includes validating the syntax, building the object tree, managing garbage collection, and so on. A lot of parsing overhead.
And it's not just the JSON parsing overhead. Looking at lodash: the string "Lodash modular utilities." appears in every single version—that's 100+ times. "MIT" appears 100+ times. "git+https://github.com/lodash/lodash.git" is duplicated for every version, the URL "https://lodash.com/" appears in every version. Overall, lots of repeated strings.
In memory, JavaScript creates a separate string object for each string. This wastes memory and makes comparisons slower. Every time the package manager checks if two packages use the same version of postcss, it's comparing separate string objects rather than pointing to the same interned string.
Bun stores package manifests in a binary format. When Bun downloads package information, it parses the JSON once and stores it as binary files (.npm files in ~/.bun/install/cache/). These binary files contain all the package information (versions, dependencies, checksums, etc.) stored at specific byte offsets.
When Bun accesses the name lodash, it's just pointer arithmetic: string_buffer + offset. No allocations, no parsing, no object traversal, just reading bytes at a known location.
// Pseudocode

// String buffer (all strings stored once)
string_buffer = "lodash\0MIT\0Lodash modular utilities.\0git+https://github.com/lodash/lodash.git\0https://lodash.com/\04.17.20\04.17.21\0..."
                 ^0     ^7   ^11                        ^37                                      ^79                   ^99      ^107

// Version entries (fixed-size structs)
versions = [
  { name_offset: 0, name_len: 6, version_offset: 99, version_len: 7, desc_offset: 11, desc_len: 26, license_offset: 7, license_len: 3, ... },  // 4.17.20
  { name_offset: 0, name_len: 6, version_offset: 107, version_len: 7, desc_offset: 11, desc_len: 26, license_offset: 7, license_len: 3, ... }, // 4.17.21
  // ... 100+ more version structs
]
To check if packages need updating, Bun stores the responses's ETag , and sends If-None-Match headers. When npm responds with "304 Not Modified", Bun knows the cached data is fresh without parsing a single byte.
Looking at the benchmarks:
Benchmark 1: bun install # fresh
  Time (mean ± σ):     230.2 ms ± 685.5 ms    [User: 145.1 ms, System: 161.9 ms]
  Range (min … max):     9.0 ms … 2181.0 ms    10 runs

Benchmark 2: bun install # cached
  Time (mean ± σ):       9.1 ms ±   0.3 ms    [User: 8.5 ms, System: 5.9 ms]
  Range (min … max):     8.7 ms …  11.5 ms    10 runs

Benchmark 3: npm install # fresh
  Time (mean ± σ):      1.786 s ±  4.407 s    [User: 0.975 s, System: 0.484 s]
  Range (min … max):    0.348 s … 14.328 s    10 runs

Benchmark 4: npm install # cached
  Time (mean ± σ):     363.1 ms ±  21.6 ms    [User: 276.3 ms, System: 63.0 ms]
  Range (min … max):   344.7 ms … 412.0 ms    10 runs

Summary
  bun install # cached ran
    25.30 ± 75.33 times faster than bun install # fresh
    39.90 ± 2.37 times faster than npm install # cached
   	196.26 ± 484.29 times faster than npm install # fresh
Here you can see that a cached(!!) npm install is slower than a fresh Bun install. That's how much overhead JSON parsing the cached files can add (among other factors).
Now that Bun has fetched the package manifests, it needs to download and extract compressed tarballs from the npm registry.
Tarballs are compressed archive files (like .zip files) that contain all the actual source code and files for each package.
Most package managers stream the tarball data as it arrives, and decompress as it streams in. When you extract a tarball that's streaming in, the typical pattern assumes the size is unknown, and looks something like this:
let buffer = Buffer.alloc(64 * 1024); // Start with 64KB
let offset = 0;

function onData(chunk) {
  while (moreDataToCome) {
    if (offset + chunk.length > buffer.length) {
      // buffer full → allocate bigger one
      const newBuffer = Buffer.alloc(buffer.length * 2);

      // copy everything we’ve already written
      buffer.copy(newBuffer, 0, 0, offset);

      buffer = newBuffer;
    }

    // copy new chunk into buffer
    chunk.copy(buffer, offset);
    offset += chunk.length;
  }

  // ... decompress from buffer ...
}
Start with a small buffer, and let it grow as more decompressed data arrives. When the buffer fills up, you allocate a larger buffer, copy all the existing data over, and continue.
This seems reasonable, but it creates a performance bottleneck: you end up copying the same data multiple times as the buffer repeatedly outgrows its current size.
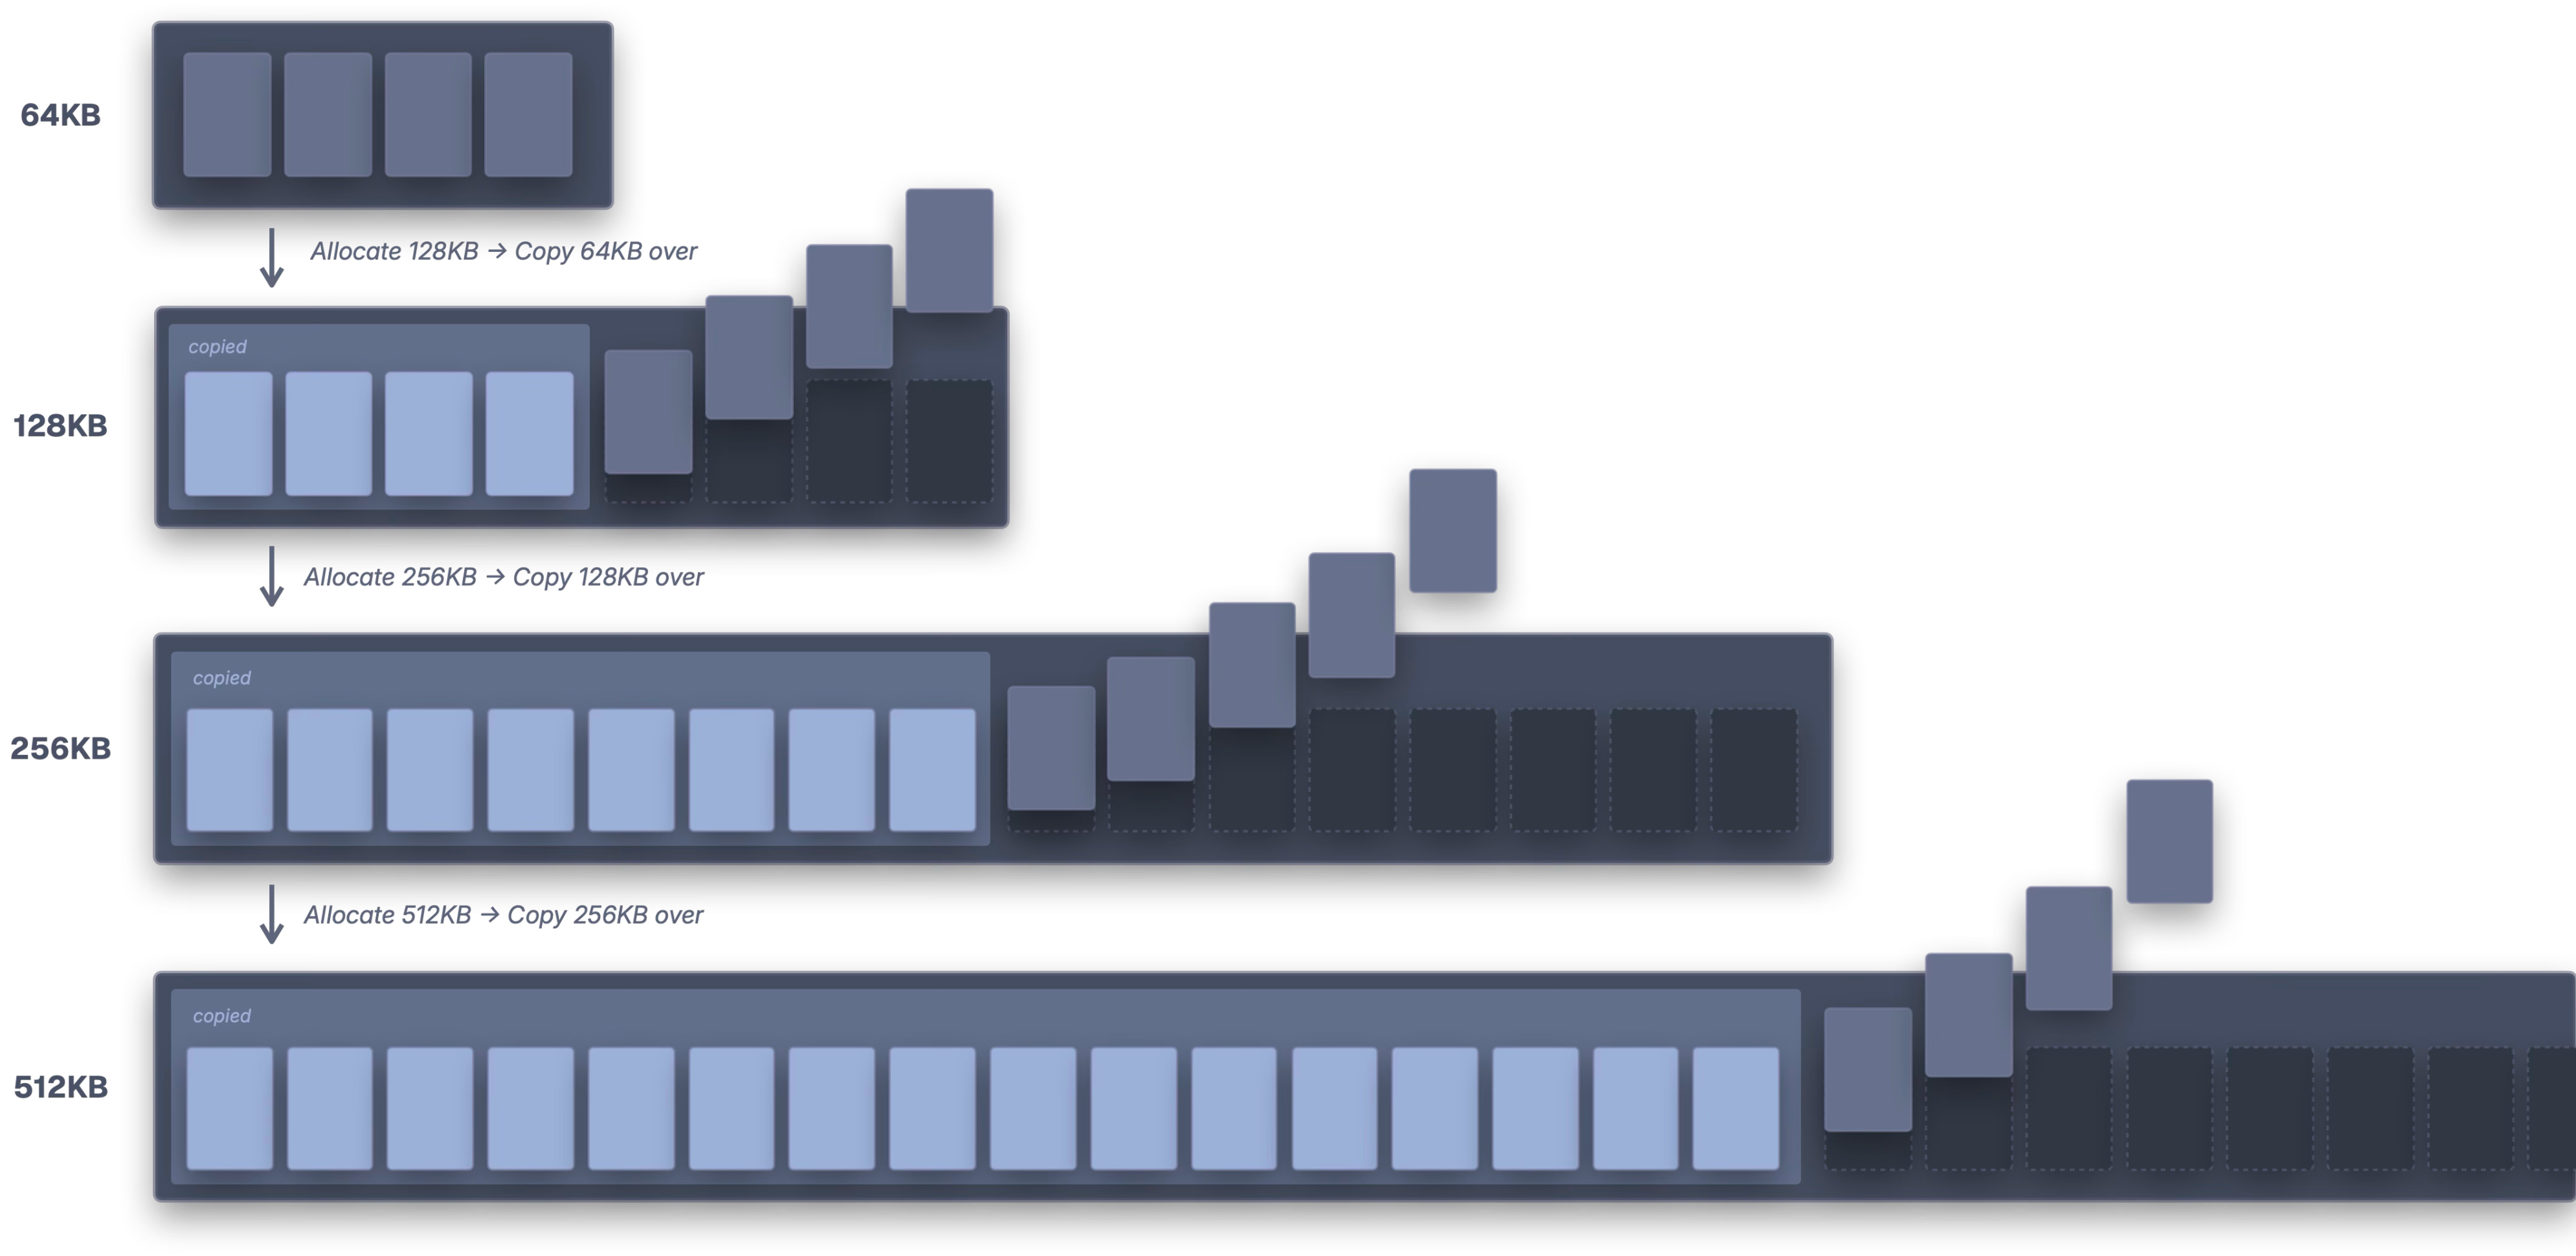
When we have a 1MB package:
- Start with 64KB buffer
- Fill up → Allocate 128KB → Copy 64KB over
- Fill up → Allocate 256KB → Copy 128KB over
- Fill up → Allocate 512KB → Copy 256KB over
- Fill up → Allocate 1MB → Copy 512KB over
You just copied 960KB of data unnecessarily! And this happens for every single package. The memory allocator has to find contiguous space for each new buffer, while the old buffer stays allocated during the copy operation. For large packages, you might copy the same bytes 5-6 times.
Bun takes a different approach by buffering the entire tarball before decompressing. Instead of processing data as it arrives, Bun waits until the entire compressed file is downloaded into memory.
Now you might think "Wait, aren't they just wasting RAM keeping everything in memory?" And for large packages like TypeScript (which can be 50MB compressed), you'd have a point.
But the vast majority of npm packages are tiny, most are under 1MB. For these common cases, buffering the whole thing eliminates all the repeated copying. Even for those larger packages, the temporary memory spike is usually fine on modern systems, and avoiding 5-6 buffer copies more than makes up for it.
Once Bun has the complete tarball in memory, it can read the last 4 bytes of the gzip format. These bytes are special since store the uncompressed size of the file! Instead of having to guess how large the uncompressed file will be, Bun can pre-allocate memory to eliminate buffer resizing entirely:
{
  // Last 4 bytes of a gzip-compressed file are the uncompressed size.
  if (tgz_bytes.len > 16) {
    // If the file claims to be larger than 16 bytes and smaller than 64 MB, we'll preallocate the buffer.
    // If it's larger than that, we'll do it incrementally. We want to avoid OOMing.
    const last_4_bytes: u32 = @bitCast(tgz_bytes[tgz_bytes.len - 4 ..][0..4].*);
    if (last_4_bytes > 16 and last_4_bytes < 64 * 1024 * 1024) {
      // It's okay if this fails. We will just allocate as we go and that will error if we run out of memory.
      esimated_output_size = last_4_bytes;
      if (zlib_pool.data.list.capacity == 0) {
          zlib_pool.data.list.ensureTotalCapacityPrecise(zlib_pool.data.allocator, last_4_bytes) catch {};
      } else {
          zlib_pool.data.ensureUnusedCapacity(last_4_bytes) catch {};
      }
    }
  }
}
Those 4 bytes tell Bun "this gzip will decompress to exactly 1,048,576 bytes", so it can pre-allocate exactly this amount of memory upfront. There's no repeated resizing or copying of data; just one memory allocation.

To do the actual decompression, Bun uses libdeflate. This is a high-performance lib that decompresses tarballs faster than the standard zlib used by most package managers. It's optimized specifically for modern CPUs with SIMD instructions.
Optimized tarball extraction would've been difficult to for package managers written in Node.js. You'd need to create a separate read stream, seek to the end, read 4 bytes, parse them, close the stream, then start over with your decompression. Node's APIs aren't designed for this pattern.
In Zig it's pretty straight-forward: you just seek to the end and read the last four bytes, that's it!
Now that Bun has all the package data, it faces another challenge: how do you efficiently store and access thousands of (interdependent) packages?
Cache-Friendly Data Layout
Dealing with thousands of packages can be tricky. Each package has dependencies, which have their own dependencies, creating a pretty complex graph.
During installation, package managers have to traverse this graph to check the package versions, resolve any conflicts, and determine which version to install. They also need to "hoist" dependencies by moving them to higher levels so multiple packages can share them.
But the way that this dependency graph is stored has a big impact on performance. Traditional package managers store dependencies like this:
const packages = {
  next: {
    name: "next",
    version: "15.5.0",
    dependencies: {
      "@swc/helpers": "0.5.15",
      "postcss": "8.4.31",
      "styled-jsx": "5.1.6",
    },
  },
  postcss: {
    name: "postcss",
    version: "8.4.31",
    dependencies: {
      nanoid: "^3.3.6",
      picocolors: "^1.0.0",
    },
  },
};
This looks clean as JavaScript code, but it's not ideal for modern CPU architectures.
In JavaScript, each object is stored on the heap. When accessing packages["next"], the CPU accesses a pointer that tells it where Next's data is located in memory. This data then contains yet another pointer to where its dependencies live, which in turn contains more pointers to the actual dependency strings.
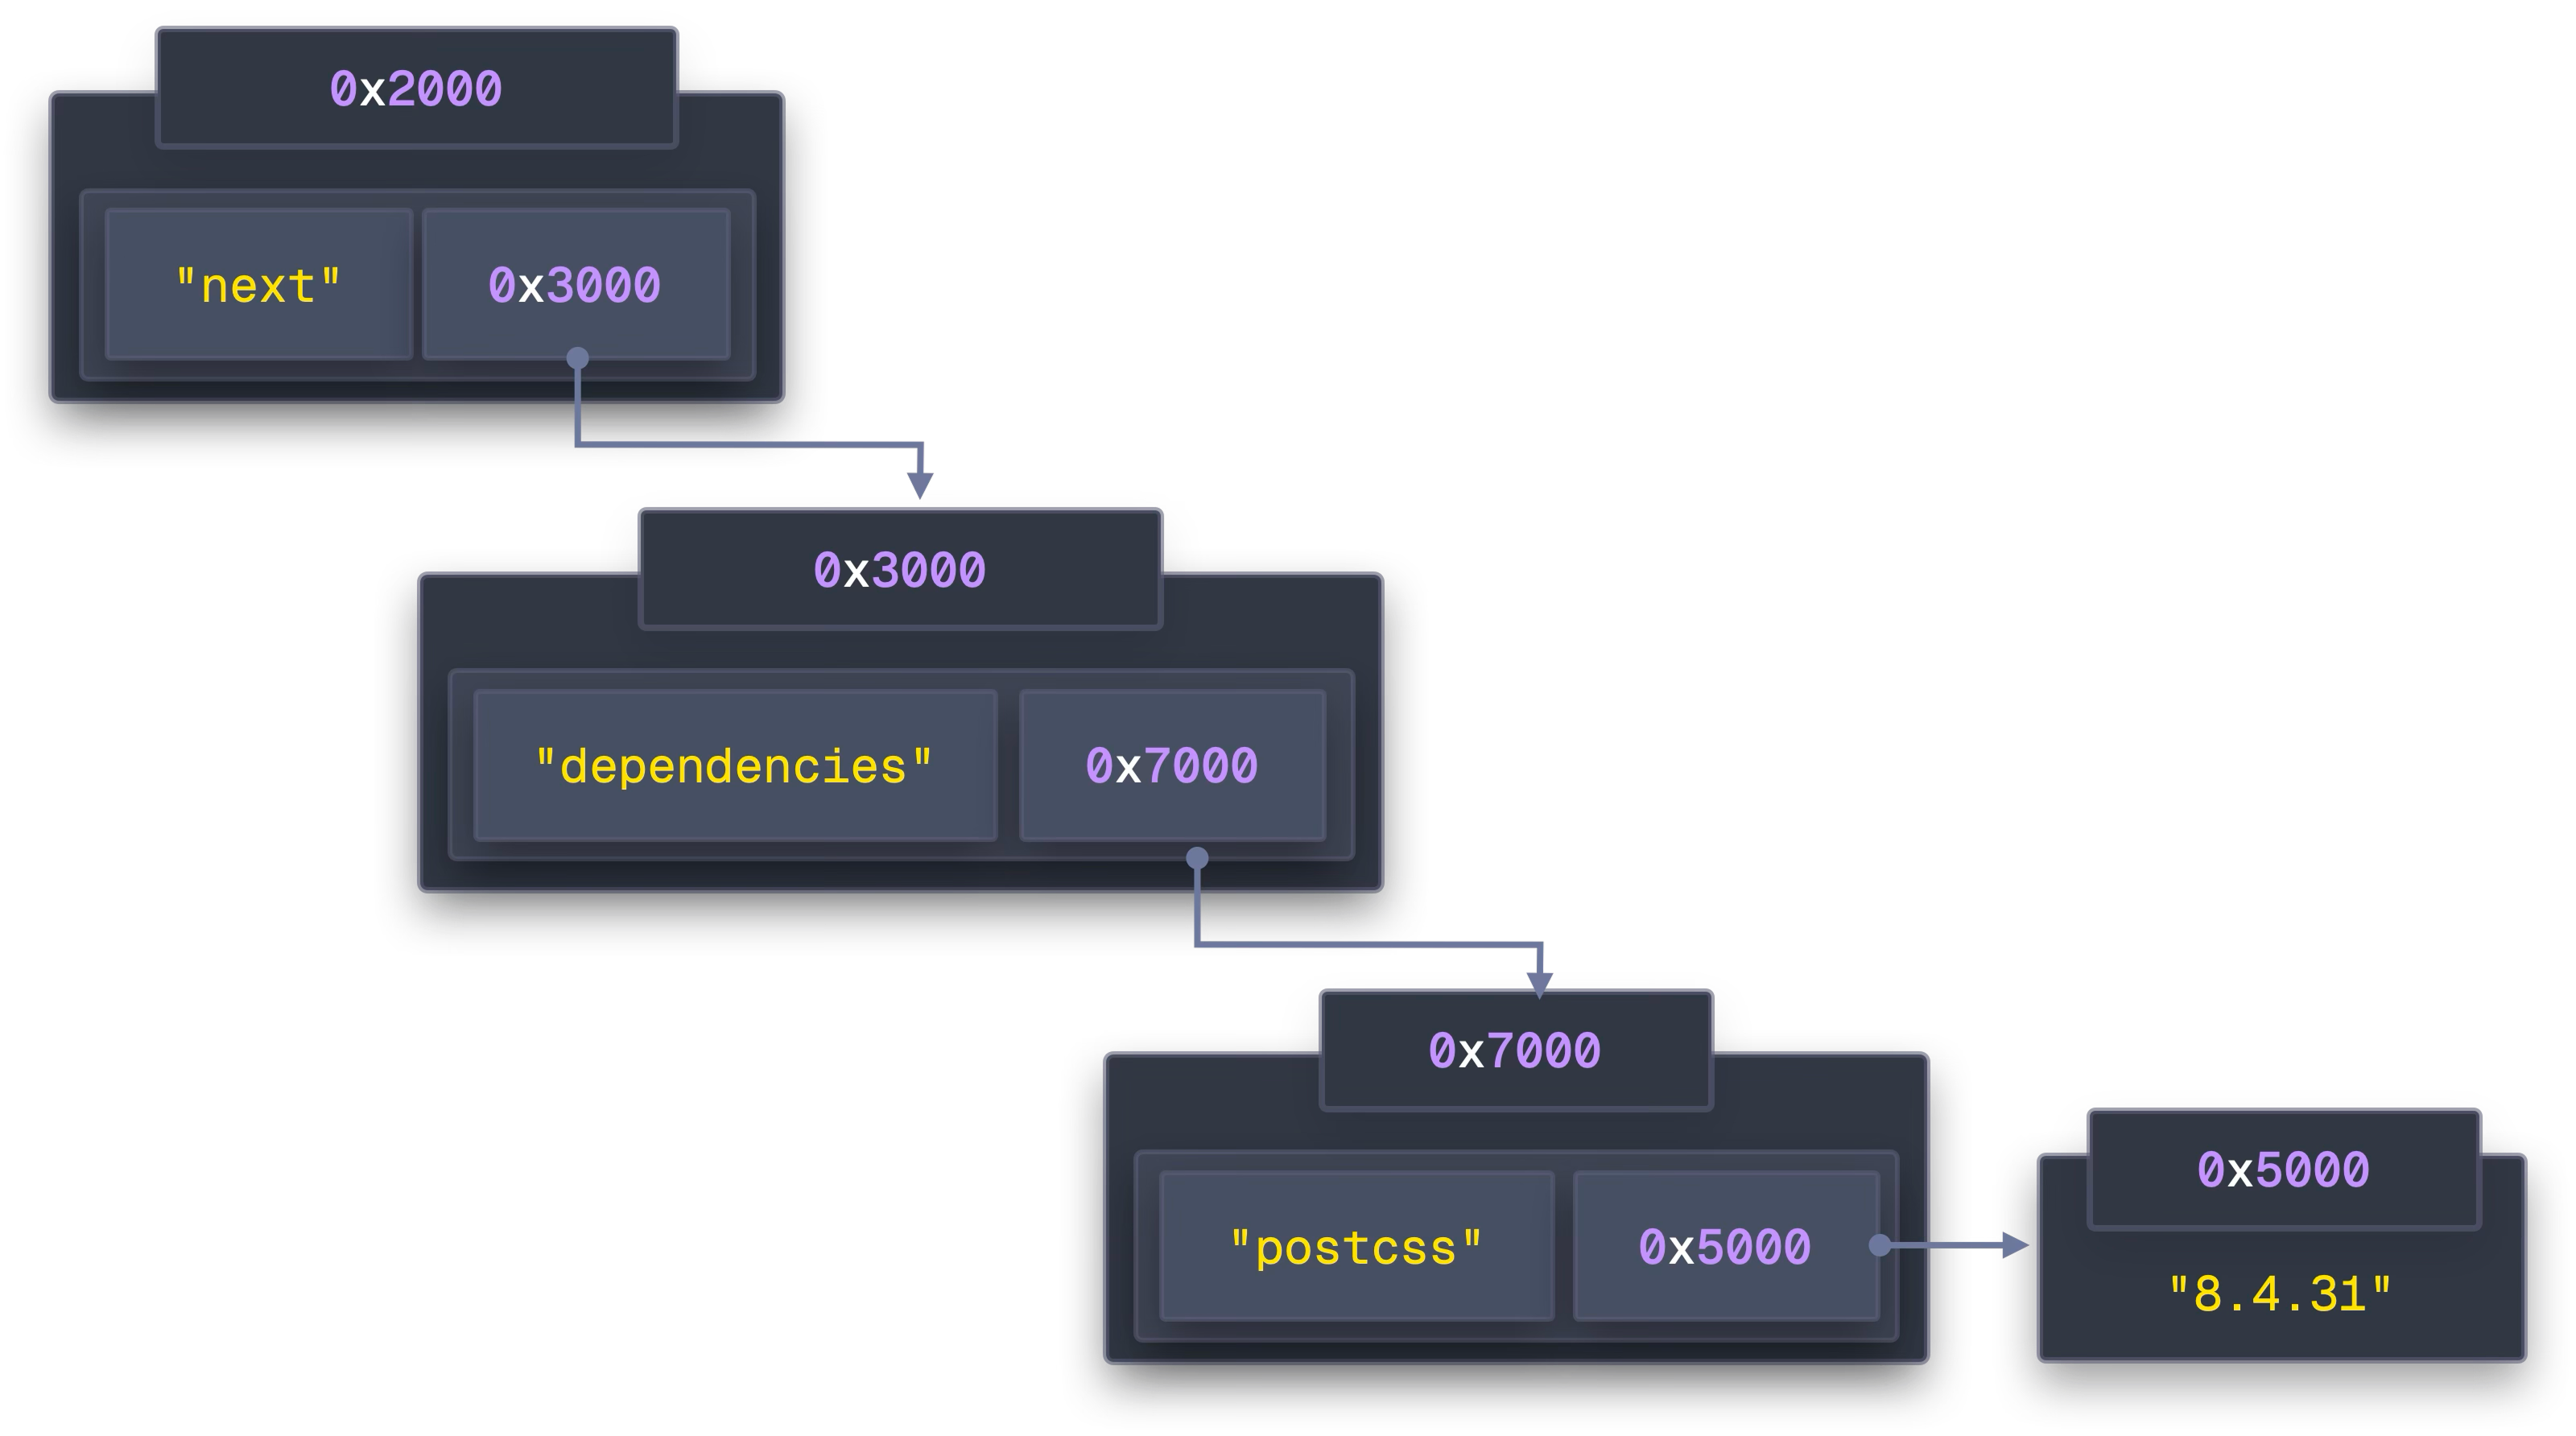
The key issue is how JavaScript allocates objects in memory. When you create objects at different times, the JavaScript engine uses whatever memory is available at that moment:
// These objects are created at different moments during parsing
packages["react"] = { name: "react", ... }  	  // Allocated at address 0x1000
packages["next"] = { name: "next", ... }     		// Allocated at address 0x2000
packages["postcss"] = { name: "postcss", ... }  // Allocated at address 0x8000
// ... hundreds more packages
These addresses are basically just random. There is no locality guarantee - objects can just be scattered across RAM, even objects that are related to each other!
This random scattering matters because of how modern CPUs actually fetch data.
Modern CPUs are incredibly fast at processing data (billions of operations per second), but fetching data from RAM is slow. To bridge this gap, CPUs have multiple cache levels:
- L1 cache, small storage, but extremely fast (~4 CPU cycles)
- L2 cache, medium storage, a bit slower (~12 CPU cycles)
- L3 cache: 8-32MB storage, requires ~40 CPU cycles
- RAM: Lots of GB, requires ~300 cycles (slow!)
The "issue" is that caches work with cache lines. When you access memory, the CPU doesn't just load that one byte: it loads the entire 64-byte chunk in which that byte appears. It figures that if you need one byte, you'll probably need nearby bytes soon (this is called spatial locality).
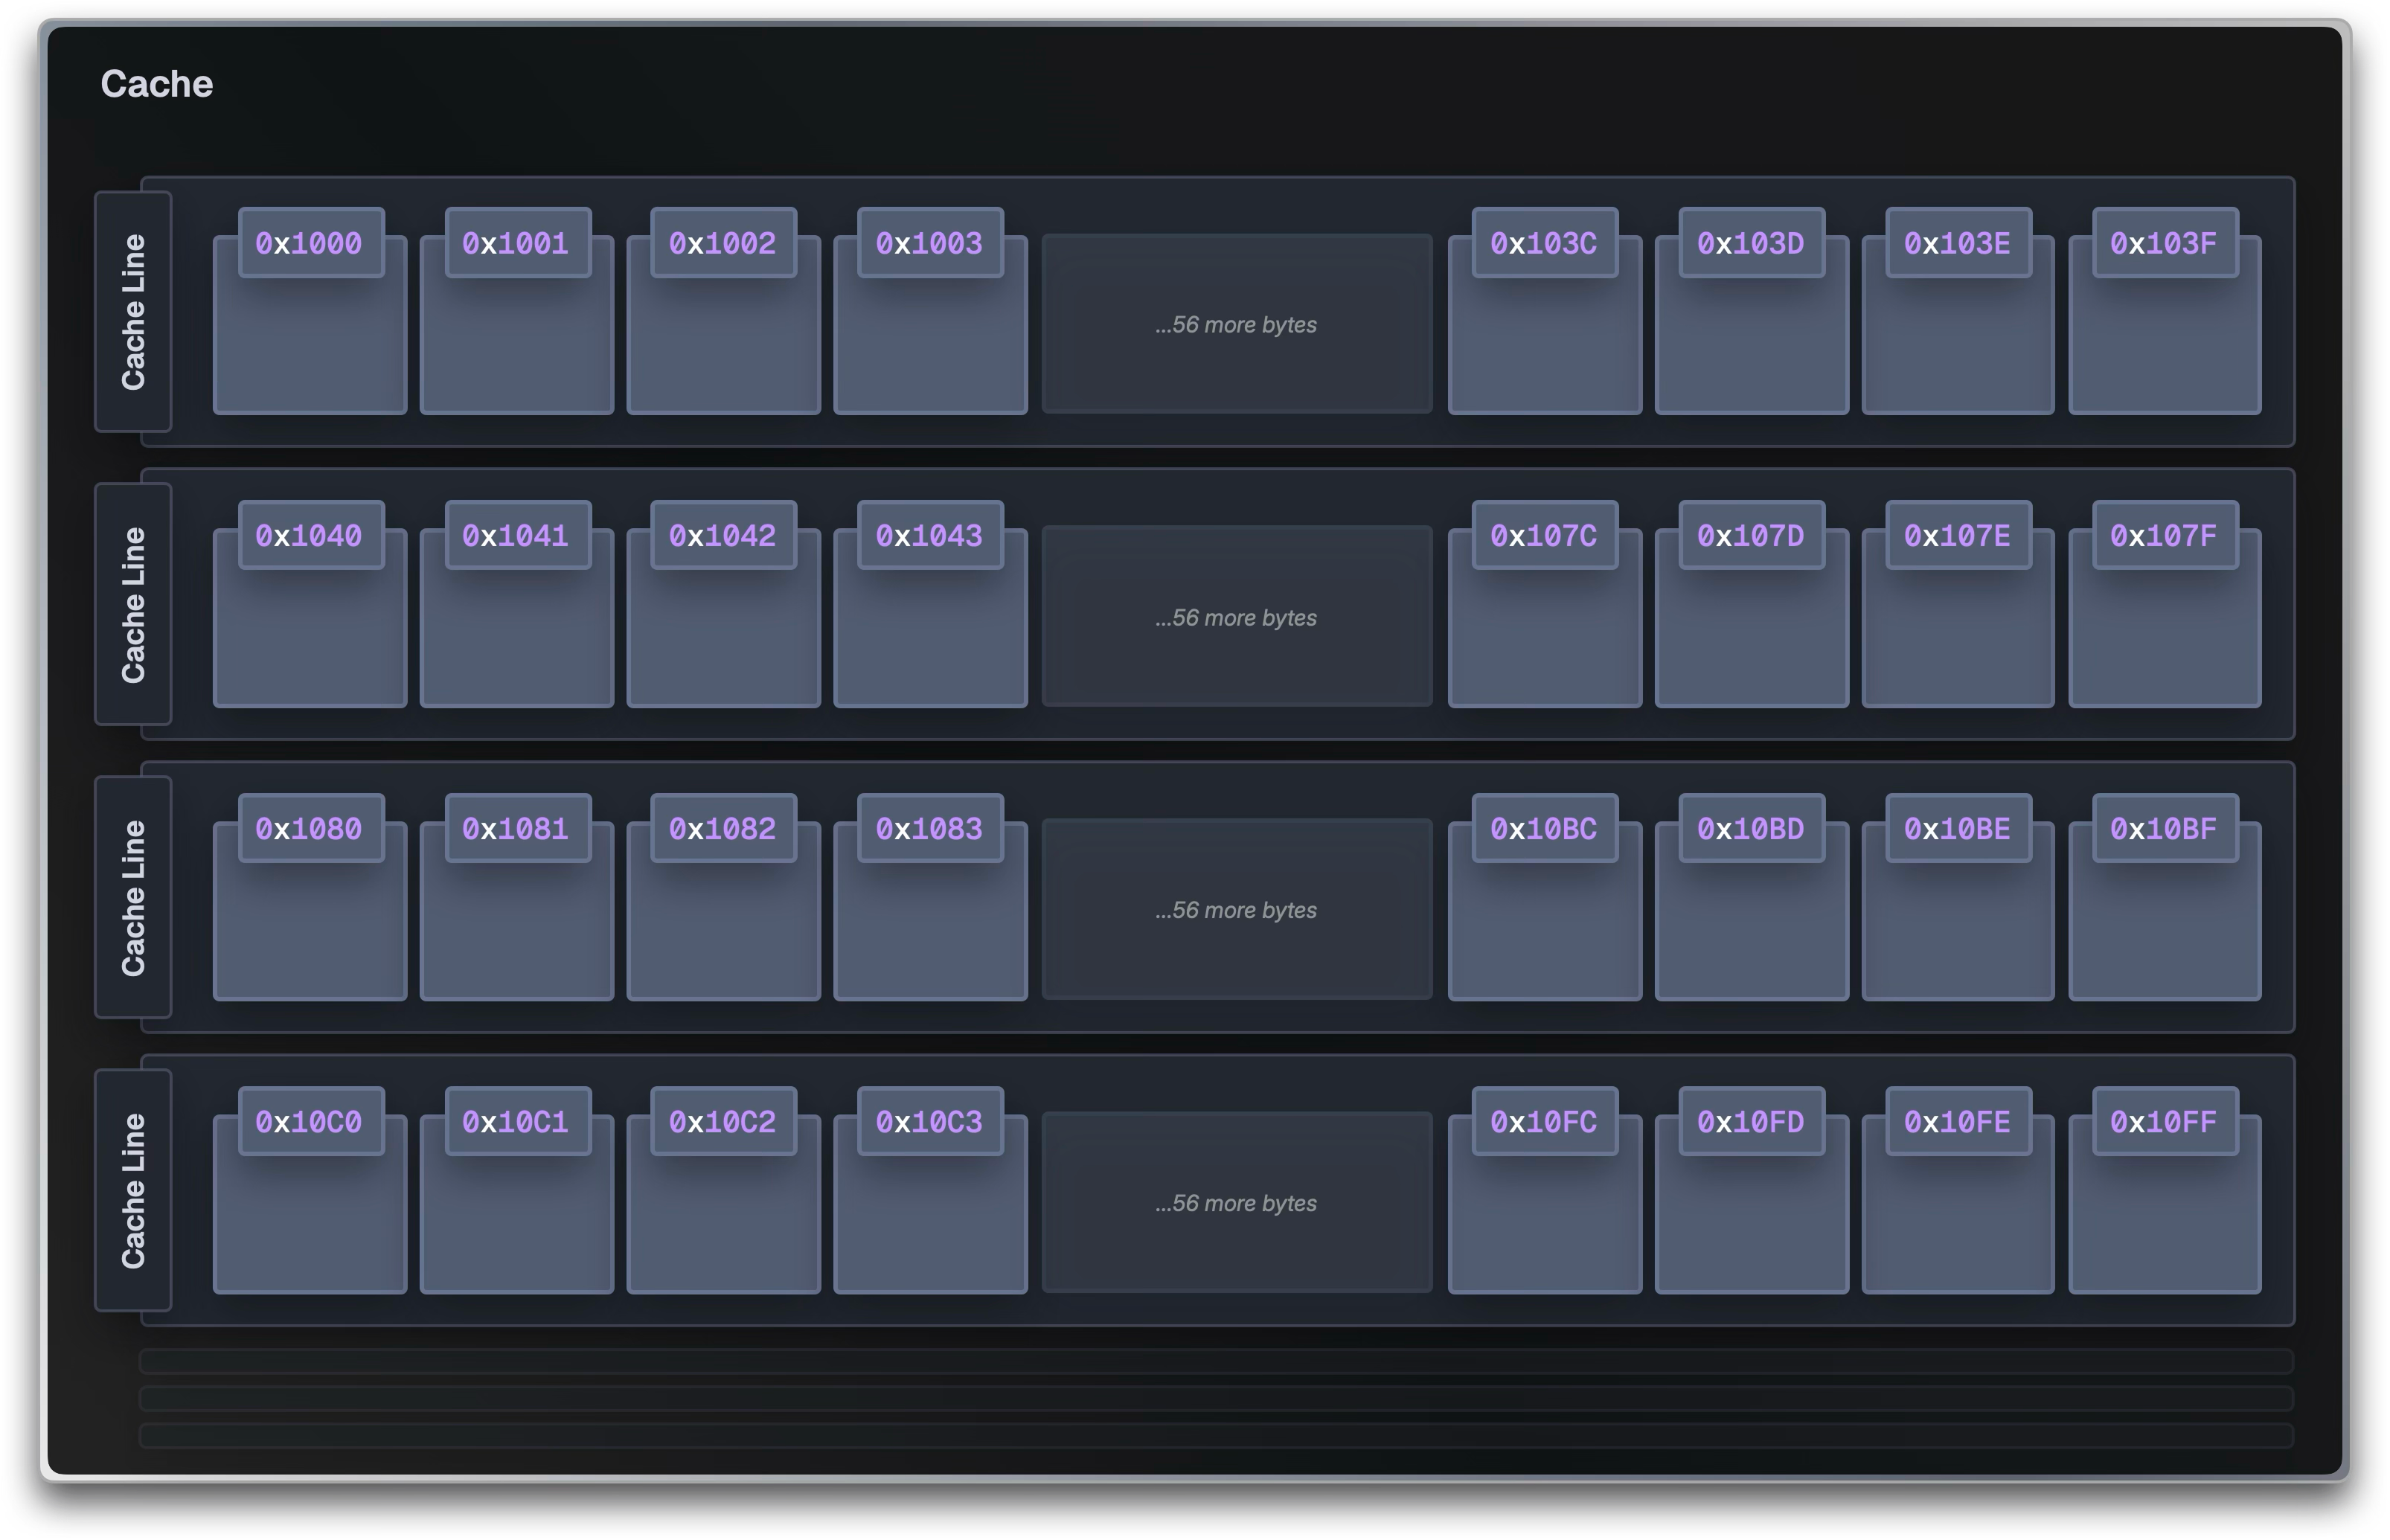
This optimization works great for data that's stored sequentially, but it backfires when your data is scattered randomly across memory.
When the CPU loads packages["next"] at address 0x2000, it actually loads all the bytes within that cache line. But the next package, packages["postcss"], is at address 0x8000 . This is a completely different cache line! The other 56 bytes the CPU loaded in the cache line are just completely wasted, they're just random memory from whatever happened to be allocated nearby; maybe garbage, maybe parts of unrelated objects.
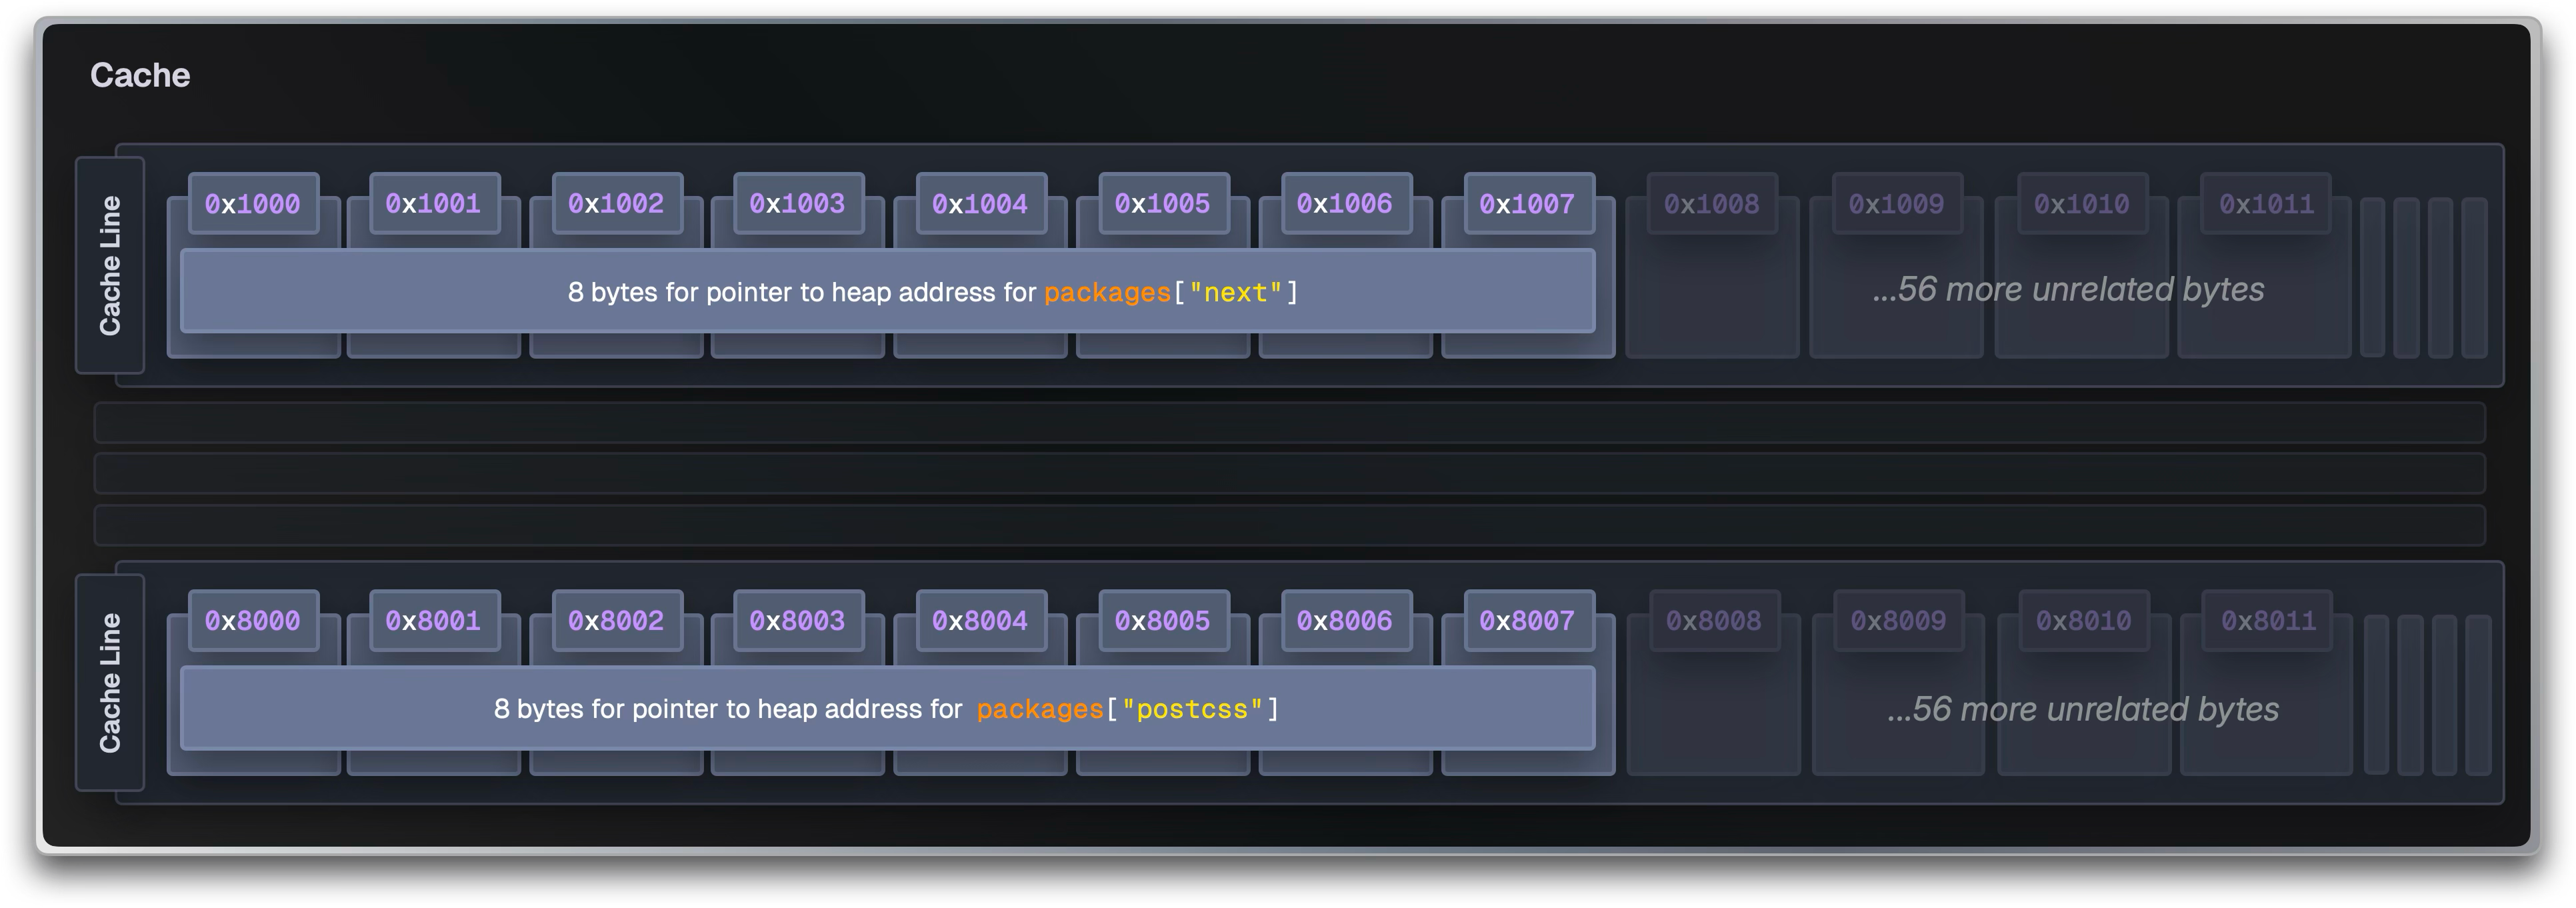
But you paid the cost of loading 64 bytes but only used 8...
By the time it's accessed 512 different packages (32KB / 64 bytes), you've filled your entire L1 cache already. Now every new package access evicts a previously loaded cache line to make space. The package you just accessed will be evicted soon, and that dependency it needs to check in 10 microseconds is already gone. Cache hit rate drops, and every access becomes a ~300 cycle trip to RAM instead of a 4 cycle L1 hit, far from optimal.
The nested structure of objects creates whats called "pointer chasing", a common anti-pattern in system programming. The CPU can't predict where to load next because each pointer could point anywhere. It simply cannot know where next.dependencies lives until it finishes loading the next object.
When traversing Next's dependencies, the CPU has to perform multiple dependent memory loads:
- Load
packages["next"]pointer → Cache miss → RAM fetch (~300 cycles) - Follow that pointer to load
next.dependenciespointer → Another cache miss → RAM fetch (~300 cycles) - Follow that to find
"postcss"in the hash table → Cache miss → RAM fetch (~300 cycles) - Follow that pointer to load the actual string data → Cache miss → RAM fetch (~300 cycles)
We can end up with many cache misses since we're working with hundreds of dependencies, all scattered across memory. Each cache line we load (64 bytes) might contain data for just one object. With all those objects spread across GBs of RAM, the working set easily exceeds the L1 cache (32KB), L2 (256KB) and even the L3 cache (8-32MB). By the time we need an object again, it's likely that it's been evicted from all cache levels.
That's ~1200 cycles (400ns on a 3GHz CPU) just to read one dependency name! For a project with 1000 packages averaging 5 dependencies each, that's 2ms of pure memory latency.
Bun uses Structure of Arrays. Instead of each package storing its own dependency array, Bun keeps all dependencies in one big shared array, all package names in another shared array, and so on:
// ❌ Traditional Array of Structures (AoS) - lots of pointers
packages = {
  next: { dependencies: { "@swc/helpers": "0.5.15", "postcss": "8.4.31" } },
};

// ✅ Bun's Structure of Arrays (SoA) - cache friendly
packages = [
  {
    name: { off: 0, len: 4 },
    version: { off: 5, len: 6 },
    deps: { off: 0, len: 2 },
  }, // next
];

dependencies = [
  { name: { off: 12, len: 13 }, version: { off: 26, len: 7 } }, // @swc/[email protected]
  { name: { off: 34, len: 7 }, version: { off: 42, len: 6 } }, // [email protected]
];

string_buffer = "next\015.5.0\0@swc/helpers\00.5.15\0postcss\08.4.31\0";
Instead of each package storing pointers to its own data scattered across memory, Bun just uses large contiguous buffers, including:
packagesstores lightweight structs that specify where to find this package's data using offsetsdependenciesstores the actual dependency relationships for all packages in one placestring_bufferstores all text (names, versions, etc.) sequentially in one massive stringversionsstores all parsed semantic versions as compact structs
Now, accessing Next's dependencies just becomes arithmetic:
packages[0]tells us that Next's dependencies start at position0in thedependenciesarray, and there's 2 dependencies:{ name_offset: 0, deps_offset: 0, deps_count: 2 }- Go to
dependencies[1]which tells us that postcss's name starts at position34in the stringstring_buffer, and version at position42:{ name_offset: 34, version_offset: 42 } - Go to position 34 in
string_bufferand readpostcss - Go to position 42 in
string_bufferand read"8.4.31" - … and so on
Now when you access packages[0], the CPU doesn't just load those 8 bytes: it loads an entire 64-byte cache line. Since each package is 8 bytes, and 64 ÷ 8 = 8, you get packages[0] through packages[7] in a single memory fetch.
So when your code processes the react dependency (packages[0], packages[1] through packages[7] are already sitting in your L1 cache, ready to be accessed with zero additional memory fetches. That's why sequential access is so fast: you're getting 8 packages just by accessing memory once.
Instead of the many small, scattered allocations throughout memory that we saw in the previous example, we now have just ~6 large allocations in total, regardless of how many packages you have. This is completely different from the pointer-based approach, which required a separate memory fetch for each object.
Optimized Lockfile Format
Bun also applies the Structure of Arrays approach to its bun.lock lockfile.
When you run bun install, Bun has to parse the existing lockfile to determine what's already installed and what needs updating. Most package managers store lockfiles as nested JSON (npm) or YAML (pnpm, yarn). When npm parses package-lock.json, it's processing deeply nested objects:
{
  "dependencies": {
    "next": {
      "version": "15.5.0",
      "requires": {
        "@swc/helpers": "0.5.15",
        "postcss": "8.4.31"
      }
    },
    "postcss": {
      "version": "8.4.31",
      "requires": {
        "nanoid": "^3.3.6",
        "picocolors": "^1.0.0"
      }
    }
  }
}
Each package becomes its own object with nested dependency objects. JSON parsers must allocate memory for every object, validate syntax, and build complex nested trees. For projects with thousands of dependencies, this creates the same pointer-chasing problem we saw earlier!
Bun applies the Structure of Arrays approach to its lockfile, in a human-readable format:
{
  "lockfileVersion": 0,
  "packages": {
    "next": [
      "next@npm:15.5.0",
      { "@swc/helpers": "0.5.15", "postcss": "8.4.31" },
      "hash123"
    ],
    "postcss": [
      "postcss@npm:8.4.31",
      { "nanoid": "^3.3.6", "picocolors": "^1.0.0" },
      "hash456"
    ]
  }
}
This again deduplicates strings, and stores dependencies in a cache-friendly layout. They're stored following dependency order rather than alphabetically or in a nested hierarchy. This means that a parser can read memory more efficiently (sequentially), avoiding random jumps between objects.
And not only that, Bun also pre-allocates memory based on the lockfile size. Just like with tarball extraction, this avoids the repeated resize-and-copy cycles that create performance bottlenecks during parsing.
As a sidenote: Bun originally used a binary lockfile format (bun.lockb) to avoid JSON parsing overhead entirely, but binary files are impossible to review in pull requests and can't be merged when conflicts happen.
File copying
After the packages are installed and cached in ~/.bun/install/cache/, Bun must copy the files into node_modules. This is where we see most of Bun's performance impact!
Traditional file copying traverses each directory and copies files individually. This requires multiple system calls per file:
- opening the source file (
open()) - creating and opening the destination file (
open()) - repeatedly reading chunks from the source and writing them to the destination until complete (
read()/write()) - finally, closing both files
close().
Each of these steps requires that expensive mode switch between user mode and the kernel.
For a typical React app with thousands of package files, this generates hundreds of thousands to millions of system calls! This is exactly the systems programming problem we described earlier: the overhead of making all these system calls becomes more expensive than actually moving the data.
Bun uses different strategies depending on your operating system and filesystem, leveraging every OS-specific optimization available. Bun supports several file copying backends, each with different performance characteristics:
macOS
On macOS, Bun uses Apple's native clonefile() copy-on-write system call.
clonefile can clone entire directory trees in a single system call. This system call creates new directory and file me
0 Comments
Log in to join the conversation.No comments yet. Be the first to share your thoughts.