
You've optimized your Largest Contentful Paint. Your Time to First Byte is under 200ms. Your Lighthouse scores are green. And yet, your checkout conversion rate is quietly dropping. A segment of users in Southeast Asia is churning. Your support team is fielding tickets about a form that "just doesn't work" and you have no idea which one.
Traditional frontend performance monitoring tells you whether your application is fast. It doesn't tell you whether people are actually succeeding when using it. It can't reveal which workflows are failing, which user segments are affected, or whether a JavaScript error is quietly preventing customers from completing the actions that matter most.
We think of this as the user experience: whether people can successfully accomplish the tasks they came to your application to perform. That's the visibility Grafana Cloud Frontend Observability is built to provide. In this post, we'll explore how Frontend Observability helps you understand your users' experience through user action tracking, geolocation insights, and a redesigned errors view that prioritizes impact over volume.
Performance monitoring solves half of the problem
The case for performance monitoring is well established. Users leave slow pages. Load times correlate with conversion rates and bounce rates. Core Web Vitals exist because Google and the rest of the web industry recognized that page speed is a proxy for the user experience and an important thing to optimize.
But "proxy" is the key word. Performance monitoring was built to answer one question: "How efficiently does my app deliver content?" It's the wrong instrument for the questions that actually drive outcomes for a product: "Are users completing the flows I've built? Which interactions are breaking? Does my app work the same way for everyone, everywhere?"
These are, instead, questions about user health and whether users are reaching their goals, hitting friction, or failing silently. Frontend engineers who've spent years with performance tooling know this gap. A page can be fast and still be broken. An error rate can be low in aggregate while being catastrophic for a specific segment. A workflow can look fine in staging and fail in production for reasons that no performance dashboard will ever surface.
Closing that gap requires a different kind of visibility. You need to see what users are doing, where they're doing it, and what's stopping them. That's the shift Grafana Cloud Frontend Observability helps you make.
User actions: track the workflows that matter most
Page views and session counts tell you that a user visited your app. They don't tell you what the user did there, whether they accomplished anything, or where they got stuck.
User actions in Frontend Observability let you instrument the specific interactions that define success in your product: a search submission, a checkout step, a form save, a file upload, a feature trigger. Once instrumented, each action appears in the Frontend Observability timeline alongside full signal context—errors, network requests, log events, and performance data—so you see not just that an action happened but everything that happened around it.
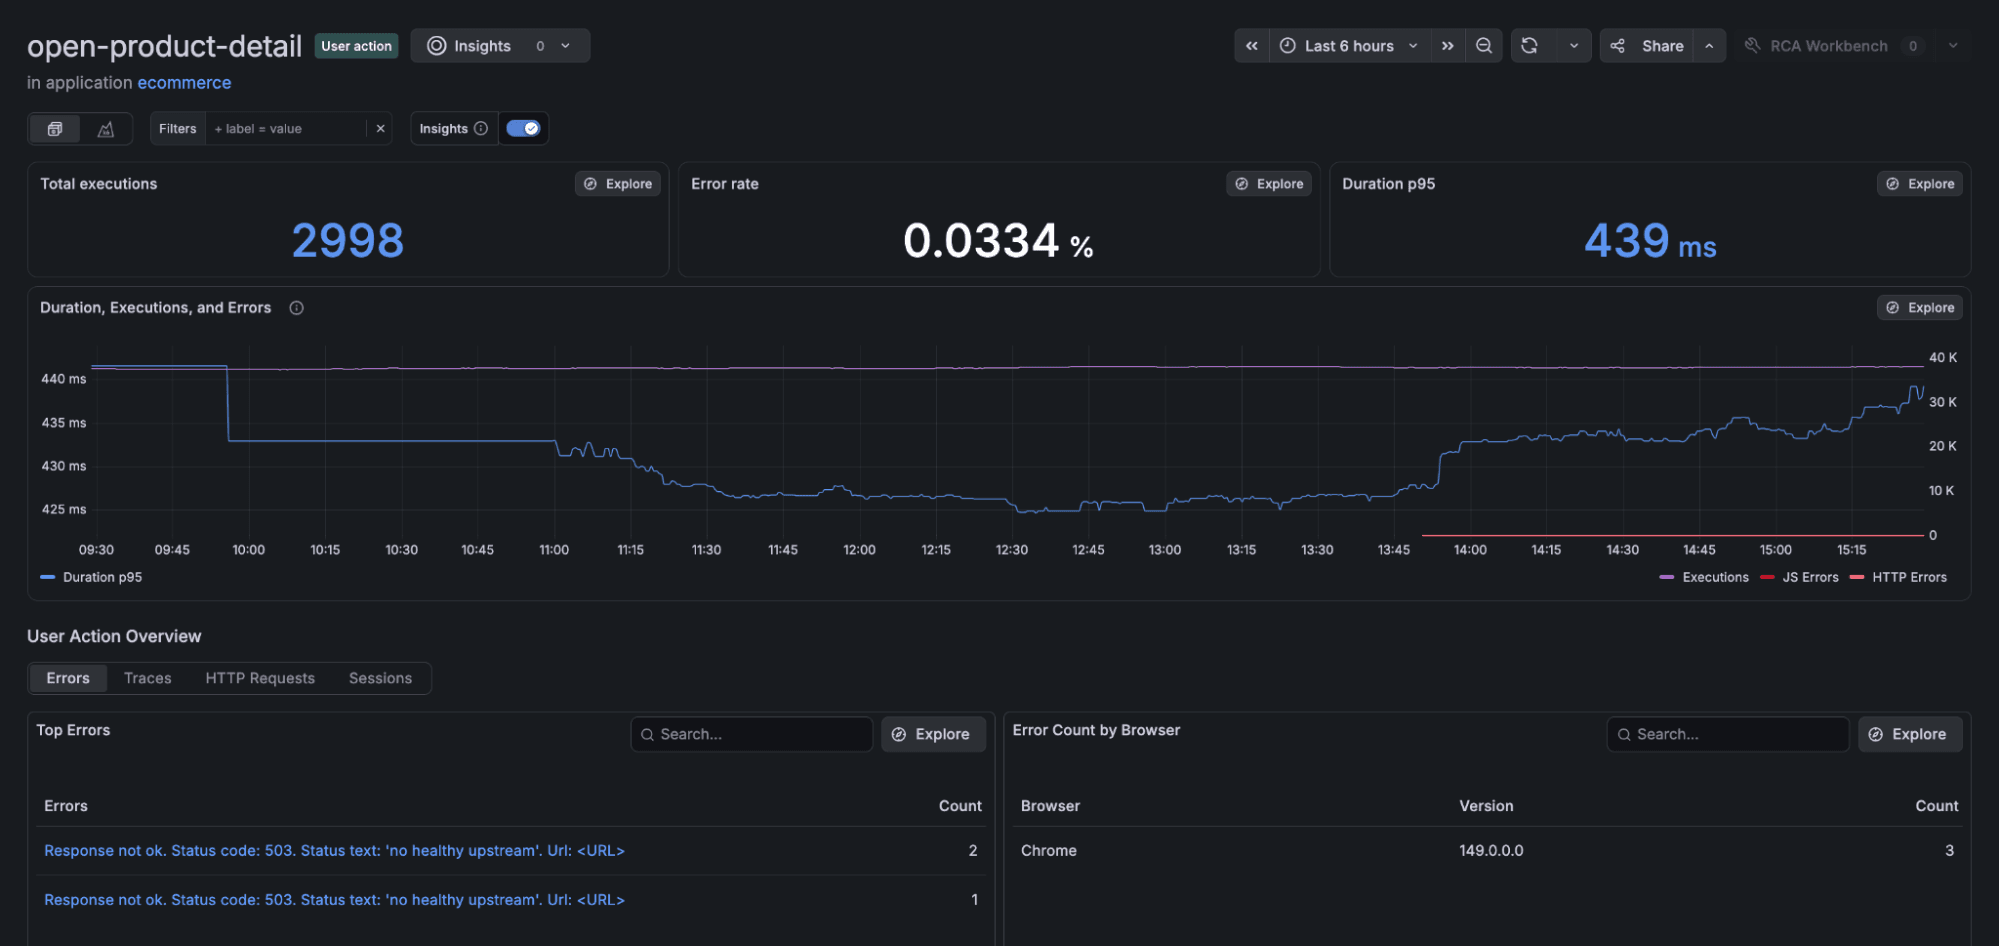
This matters most when something is wrong. Without action tracking, a degraded checkout flow is invisible at the observability layer. Sessions are happening, pages are loading, and some errors exist somewhere. With action tracking, you can see that 14% of users who reach your payment step never complete it, that the time spent on that action spiked after last Tuesday's deploy, and that every slow completion correlates with a specific network request that's timing out.
User actions also give you a foundation for measuring what users are trying to accomplish. They connect your observability practice to the goals your product was built around, not just the infrastructure that delivers it. You're watching the interactions that drive outcomes and you see exactly when and how they break.
Geolocation: understand where your users are struggling
Your test environment is not your users' environment. Your staging server, your local network, and your smaller user base give you a skewed picture of what the world actually looks like when representing your application’s experience.
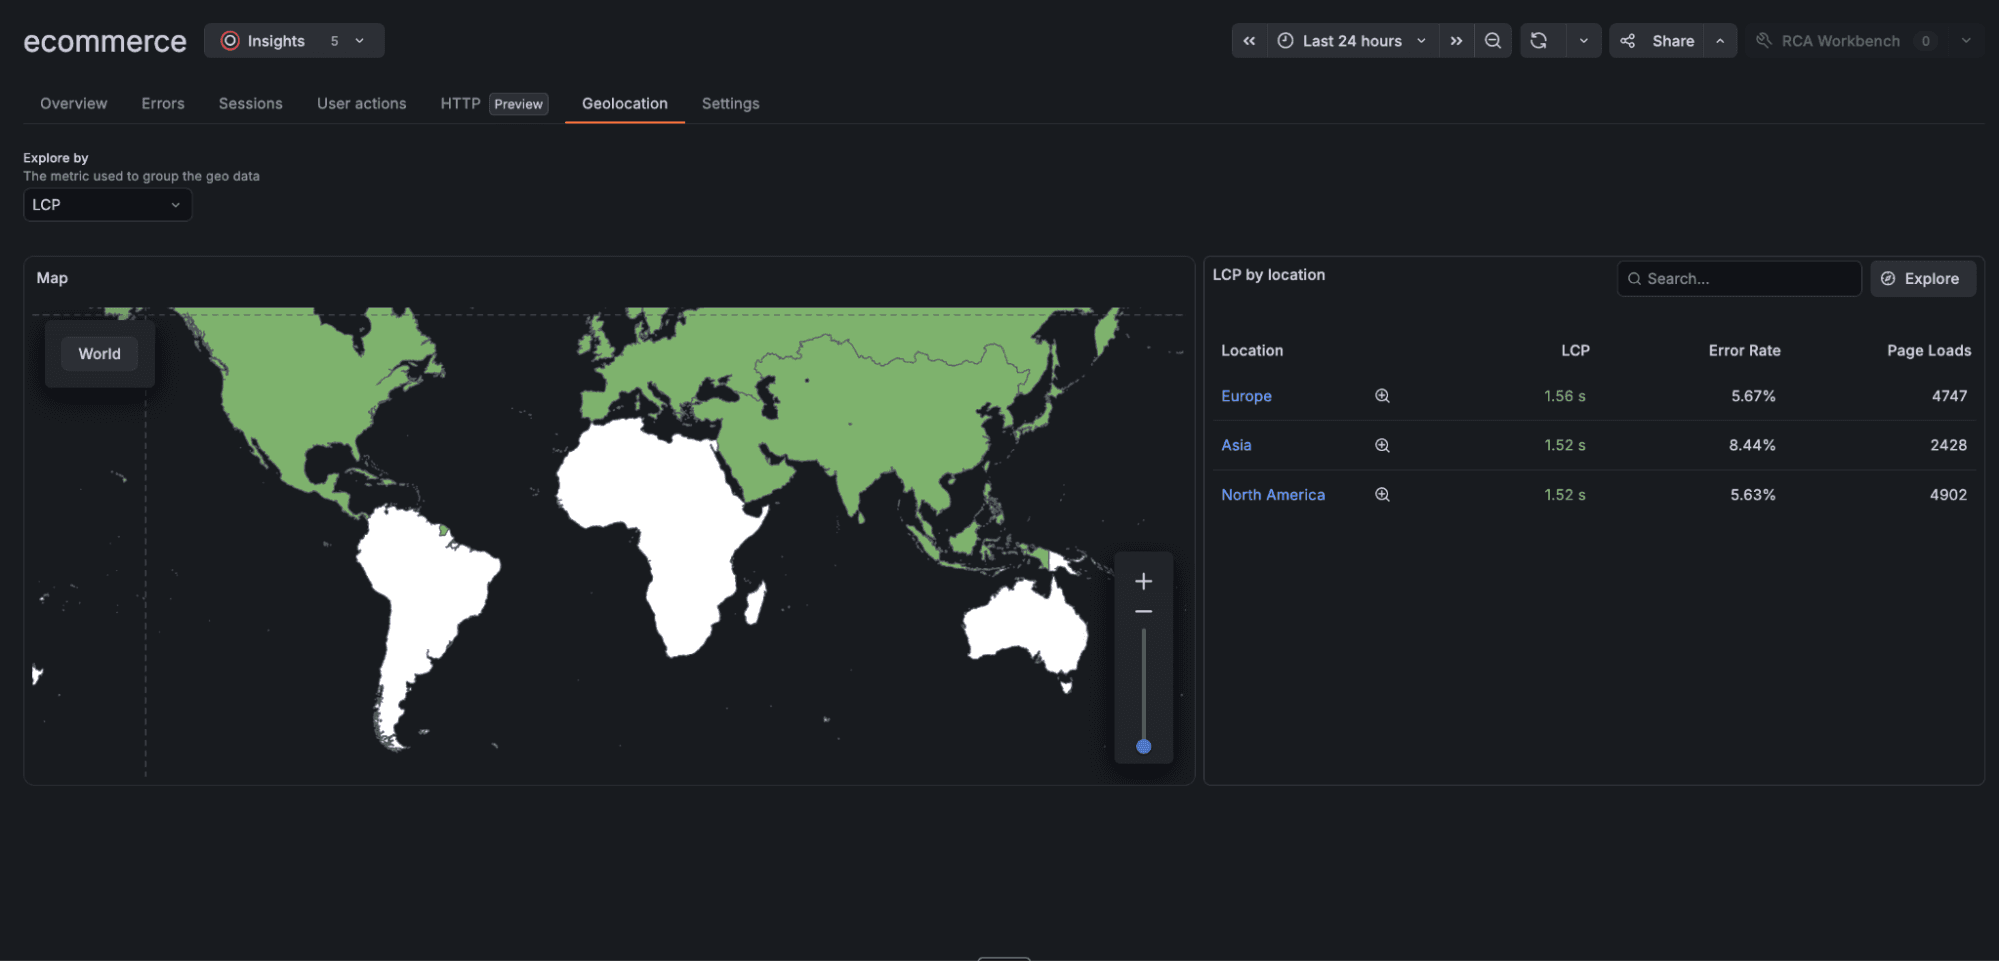
Geolocation in Grafana Cloud Frontend Observability maps session data to real-world user locations, adding a geographic lens to everything you're already collecting. Error rates, session health, performance data, and user action outcomes can all be sliced by region, so when a problem is geographically bounded, you find it before it becomes a visible trend.
For example, a CDN misconfiguration degrading load times in Southeast Asia won't surface in your global average LCP, but it will show up as elevated errors and poor session health for users in that region. A third-party authentication provider flaking in Europe won't trigger your error rate alerts if European users are a small share of your total traffic, but it will appear as a cluster of failed sessions concentrated in specific countries. A payment gateway failing for users in Brazil will generate individual support tickets long before it registers in your aggregate dashboards.
Geolocation closes the gap between "something is wrong somewhere" and "this is happening here to these users" by visualizing issues geographically. This lets you act on a local failure before it becomes a widespread one.
Redesigned errors view: triage errors by user impact, not volume
Error monitoring is not new. Most frontend teams already have some form of it. But most error monitoring tools were built around a single question: what errors are occurring? They give you a list sorted by volume or recency and leave you to figure out which ones matter.
The redesigned errors view in Grafana Cloud Frontend Observability answers a different question: which errors are affecting users, and how badly?
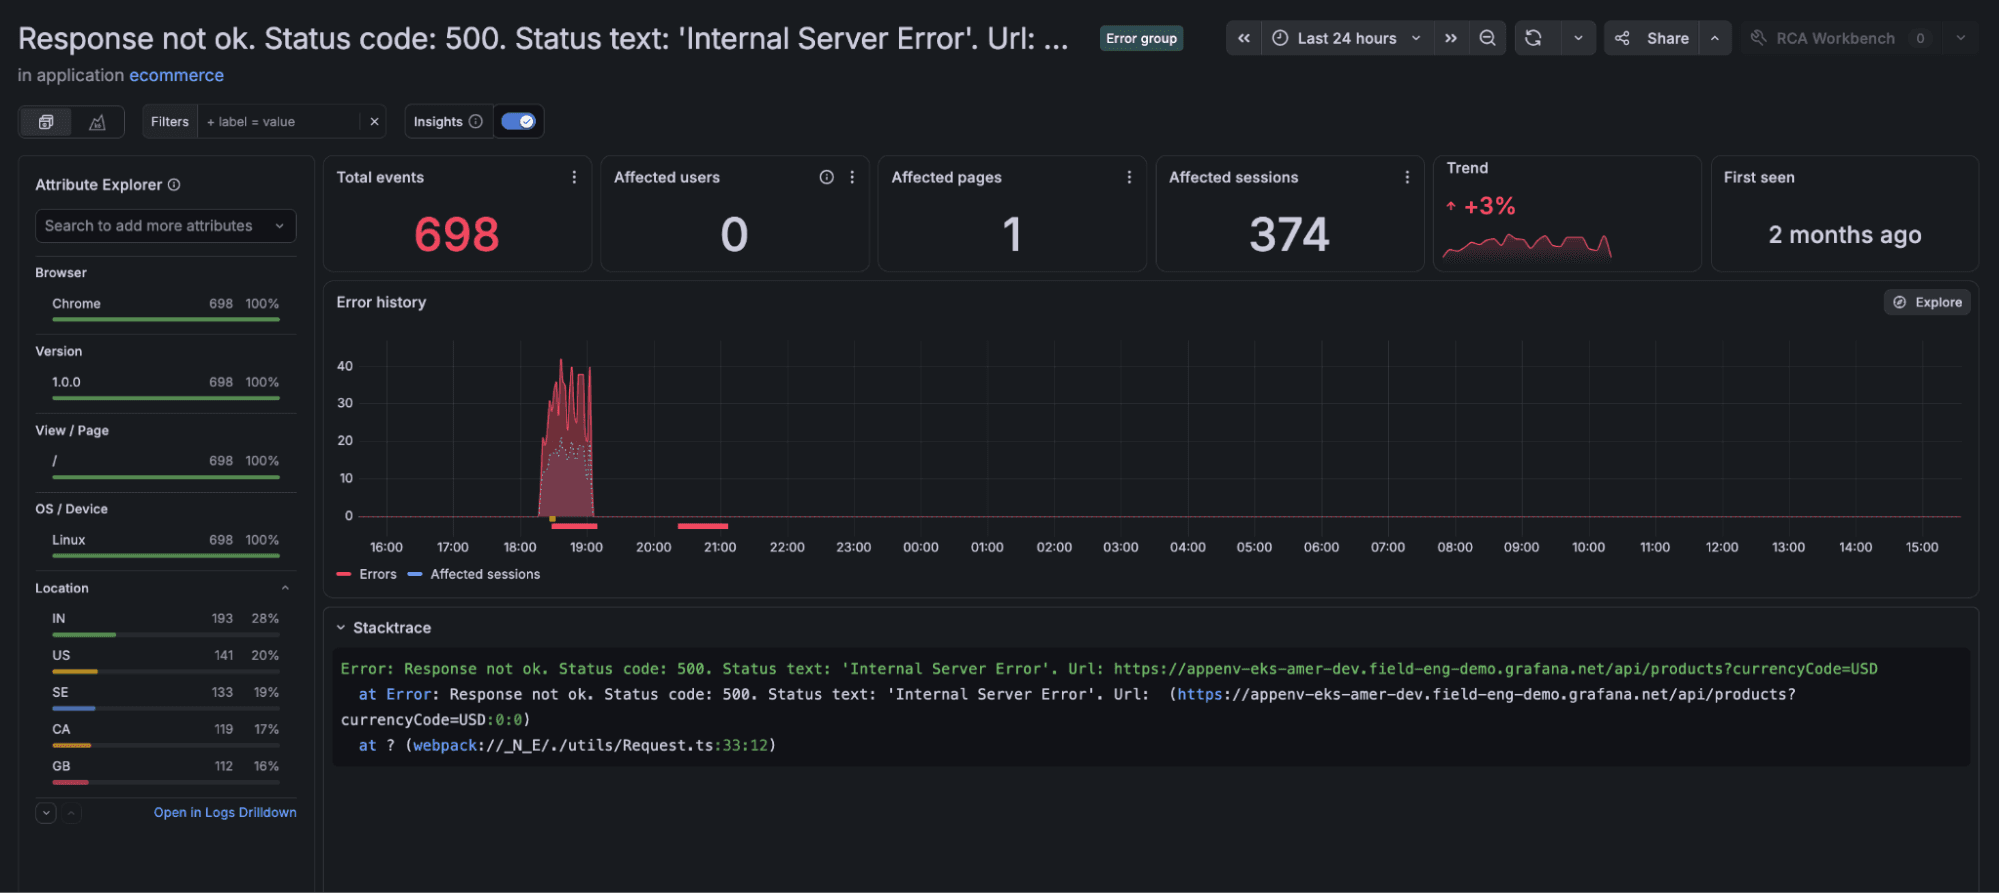
Errors are organized by user impact, how many sessions and users were affected, how recently, in what context, and in which flows. You can see at a glance which errors are hitting the most users, which are trending, and which are appearing inside your most critical user actions. When you find one worth investigating, you're not starting from a stack trace. You can drill directly into the sessions where that error occurred and view the user's exact path: what they did, what the app responded with, where the error fired, and whether the user recovered or abandoned.
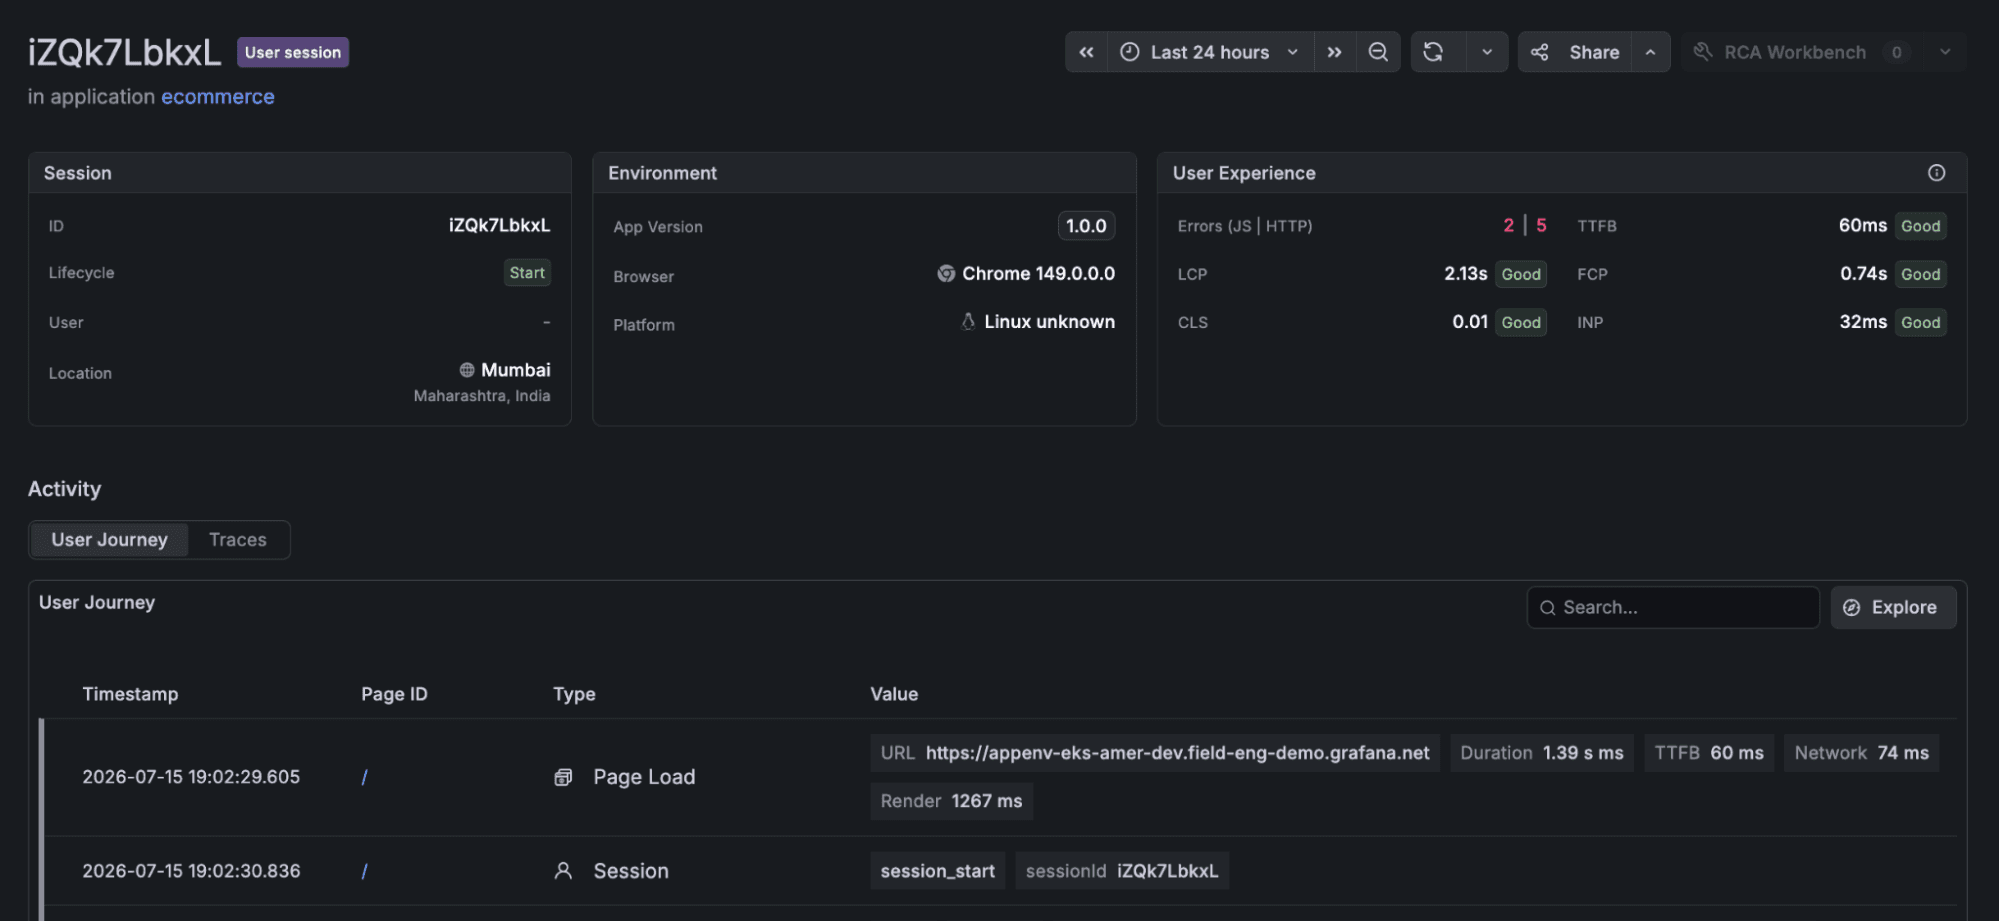
This changes how triage works. Instead of working through a backlog of JavaScript exceptions sorted by stack trace count, you start with the errors that are blocking the most users from completing the things they came to your app to do. Background script errors and low-signal exceptions move to the bottom. Errors in your checkout, onboarding, and core interaction paths move to the top.
Debug errors with Grafana Assistant
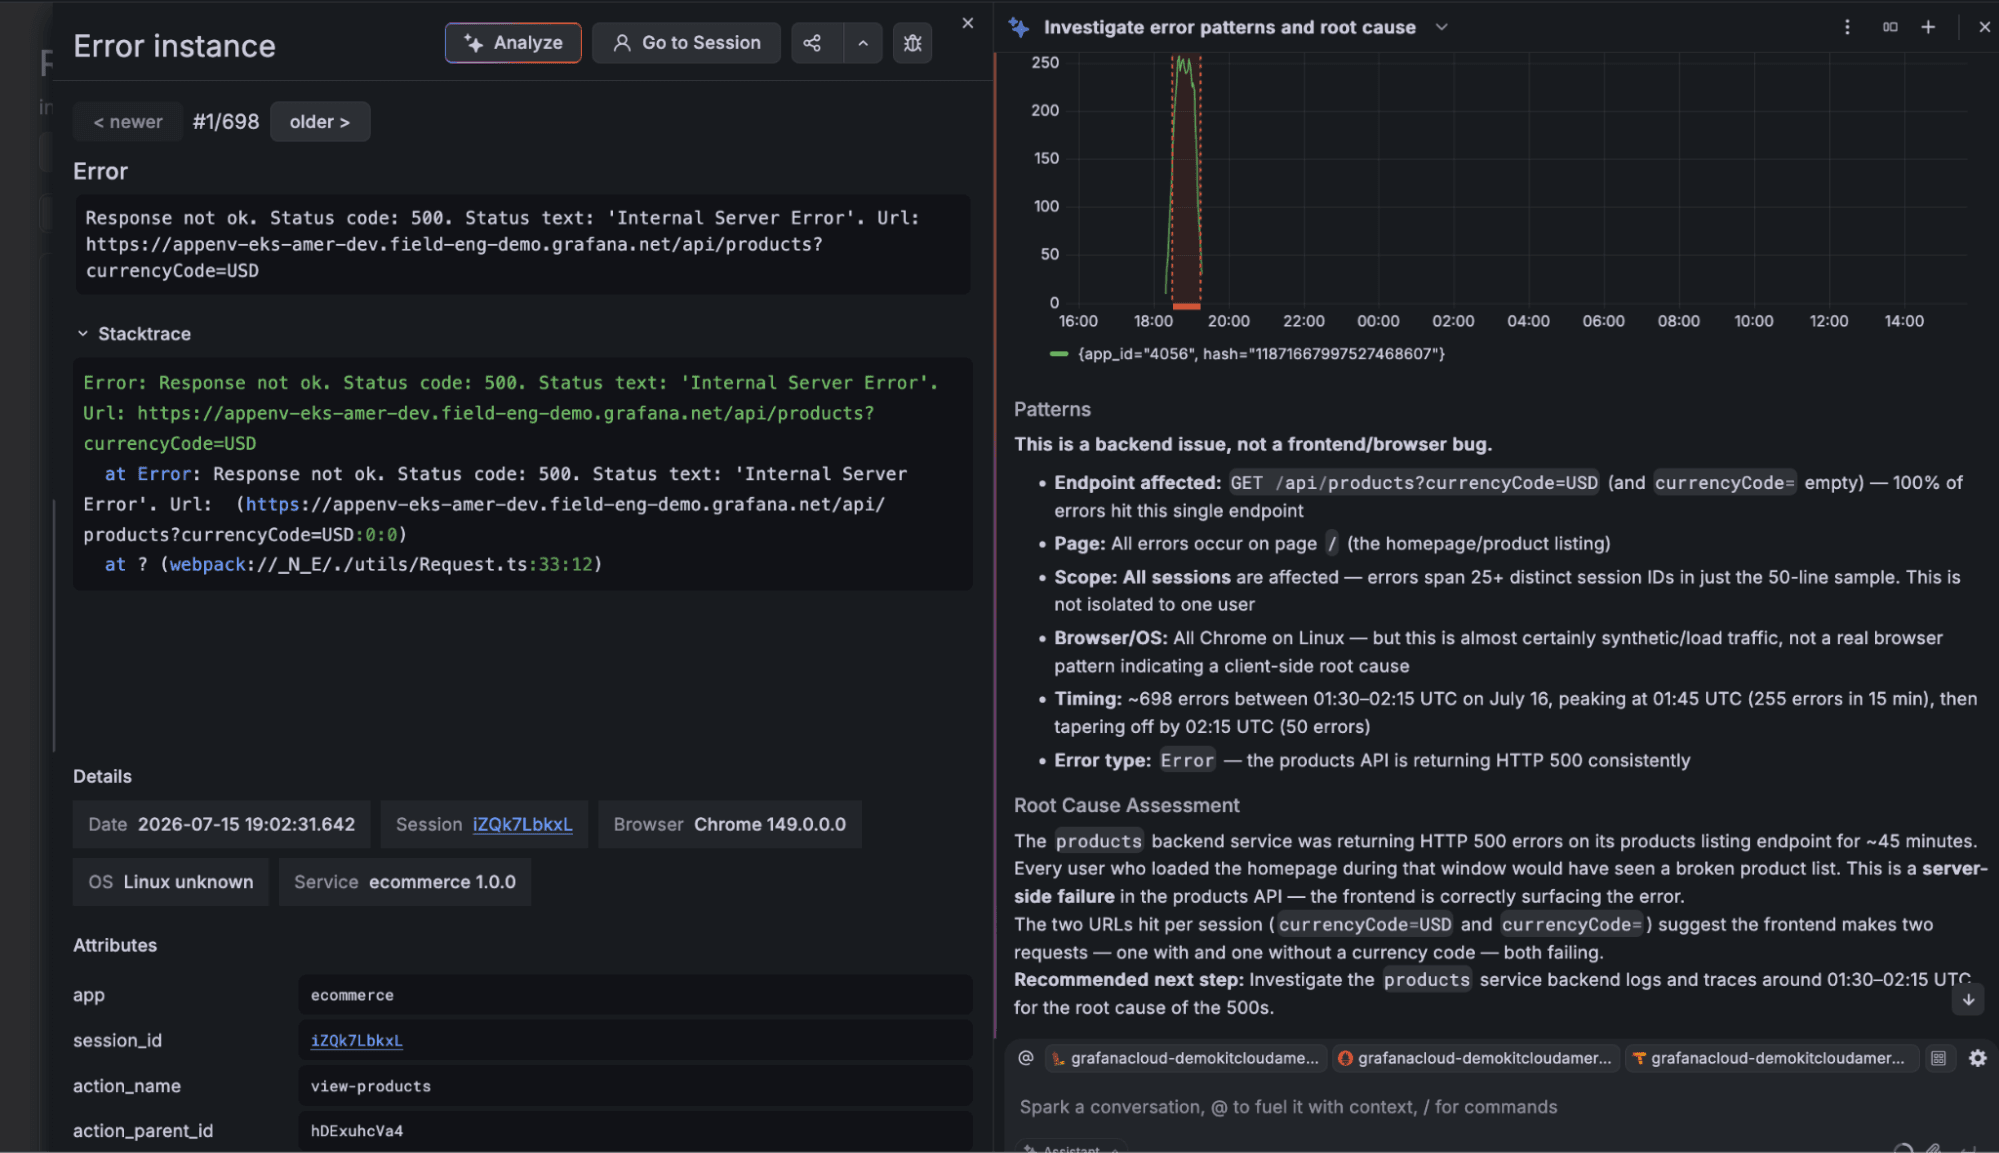
You can also use Grafana Assistant, the AI-powered agent in Grafana Cloud, to investigate and debug frontend errors even faster.
To give it a try, click the Analyze button. From there, Assistant will review errors and relevant user behavior from sessions to summarize patterns and identify root causes.
Getting started with Frontend Observability
But frontend engineers who care about their users, not just Core Web Vital scores, need visibility beyond page load times. They need to see the paths users take, the places users get stuck, and the errors that quietly block the moments that matter. User actions, geolocation, and a redesigned errors view in Frontend Observability give you that visibility, in a single place, alongside the performance data you're already collecting.
Ready to try it? If you're already on Grafana Cloud, navigate to Observability → Frontend to get started. New to Grafana Cloud? Sign up for a free account and start collecting frontend observability data in minutes.
Have feedback on what you'd like to see next? Join the conversation in the Grafana Community forum or open an issue on GitHub.
Grafana Cloud is the easiest way to get started with metrics, logs, traces, dashboards, and more. We have a generous forever-free tier and plans for every use case. Sign up for free now!
Tags
0 Comments
Log in to join the conversation.No comments yet. Be the first to share your thoughts.