

The code quality platform for teams
Code Coverage: How to Measure It, Understand the Metrics, and Improve Your Tests
Code coverage is one of those metrics that every development team talks about but few use to its full potential. Whether you’re shipping a SaaS product or maintaining a legacy monolith, understanding what your tests actually exercise-and what they miss-can make the difference between a confident release and a 2AM incident page.
This article walks you through the core coverage metrics, how to measure them with modern tools, and practical steps to improve code coverage without wasting effort on tests that don’t matter.
Code Coverage reporting is available on Qodana Ultimate and Qodana Ultimate Plus licenses. To learn more about available Qodana licenses, visit the Subscription Options and Pricing page. You can also request a demo.
TL;DR
- Code coverage is a software testing metric that measures the percentage of source code executed by your automated tests. It directly impacts software quality and deployment confidence.
- Measuring code coverage starts with choosing the right metrics-line, branch, condition, and path coverage-and using tools like Qodana, JaCoCo, Istanbul/NYC, Coverage.py, or Jest to generate coverage reports in your CI pipeline.
- Aiming for 80% code coverage is generally considered a good target for critical business logic, but achieving 100% code coverage is often impractical and costly. High coverage never guarantees bug-free software.
- To improve code coverage, use coverage reports to identify untested parts of the code, prioritize risky modules, and integrate coverage checks into your CI/CD workflow.
- For a deeper look at how coverage fits alongside structural and style checks, cross-reference our dedicated static code analysis guide.
What is Code Coverage?
Code Coverage measures the percentage of code executed during testing. If your code base has 1,000 executable lines of code and your test suite runs 900 of them, you have 90% line coverage. It’s typically expressed as a percentage and serves as a runtime metric-meaning it tracks what actually executes, not what could be problematic based on structure alone.
This makes it distinct from static code analysis, which inspects source code without execution to flag complexity, style issues, or security smells. The two are complementary: static analysis tells you where trouble might lurk, and Code Coverage tells you whether your tests actually reach those areas. We expand on this in detail here.
It’s worth clarifying the difference between Code Coverage and what’s sometimes called test coverage:
- Code Coverage focuses on how much source code executed during a test suite runs-lines, branches, conditions.
- Test coverage is broader. It asks whether business requirements and user behaviors were validated, even if every relevant line was hit.
For example, a test suite might execute 95% of the lines in a payment module, giving high Line Coverage. But if no test checks that a payment fails gracefully on a negative balance, test coverage measures for that behavior are incomplete.
Code Coverage identifies untested code that allows developers to improve testing efforts, especially in critical parts like authentication, data access layers, and error handling. Measuring Code Coverage helps discover untested paths and edge cases that could hide regressions or security issues.
Here’s a quick example in JavaScript:
function foo(a, b) {
let c = 42
if (a > 0 && b > 0)
c = c + a * b
return c
}
If your only test calls foo(1, 1), every line executes-but the else branch is never tested. Line coverage looks complete; branch coverage reveals the gap.
Core Code Coverage metrics and criteria
Coverage criteria are formal rules for determining how thorough your code execution is during tests. Rather than chasing every metric simultaneously, teams get better results by picking a small set of primary coverage metrics and focusing effort there. Here are the common coverage types you’ll encounter.
| Metric | Definition | Best For |
|---|---|---|
| Line/Statement | Checks if each line of code has been executed. Statement coverage measures executed statements in the program. | Baseline dashboards |
| Function | Function coverage checks if each function has been called at least once. | Spotting dead code |
| Branch | Branch coverage determines how many branches of control structures have been executed (e.g., both sides of an if/else). | Decision logic |
| Condition | Condition coverage tests how many boolean sub-expressions have been evaluated for both true and false. | Complex predicates |
| Path | Path coverage tests all possible execution paths in the code. | Critical algorithms |
Line coverage and statement coverage are often reported as a single percentage by most tools, making them the easiest baseline metric. But high line coverage but high line does not mean other metrics are scored high. For example, if we had 5 functions, 4 of which has 1 line, and the last of which has 100 lines in it’s body, while tests only covered the last one, the code coverage will be almost 100%, but the function coverage will be 20%.
Condition coverage goes further. For a compound expression like if (a && b || c), condition coverage demands that each boolean sub-expression (a, b, c) evaluates to both true and false across your test cases. This can reveal missing tests that branch coverage alone might hide.
Full path coverage is practically impossible for non-trivial applications due to combinatorial explosion-loops and nested branches multiply code paths exponentially. It remains useful only for particularly critical algorithms.
In safety-critical domains, more advanced criteria like Modified Condition/Decision Coverage (MC/DC) are mandated. DO-178C, for example, requires Modified Condition/Decision Coverage (MC/DC) for Level A avionics software, demonstrating that each condition independently affects the outcome of every decision.
How to measure Code Coverage in practice
Here’s how to measure Code Coverage in four steps:
- Instrument your code – Instrument your code by introducing hooks that allow coverage tools to observe execution. This can be done through source instrumentation, bytecode instrumentation, or runtime instrumentation.
- Run your automated tests – unit tests, integration tests, or end-to-end coverage tests.
- Collect coverage data – record which lines, branches, and conditions were executed.
- Generate coverage reports – HTML dashboards, terminal summaries, or machine-readable formats (Cobertura XML, LCOV).
Running coverage in practice
Qodana supports coverage reports generated by a range of popular tools, including:
- JaCoCo (Java/Kotlin)
- Jest and Istanbul/nyc (JavaScript/TypeScript)
- pytest-cov (Python)
- Coverlet (.NET)
- PHPUnit (PHP)
- go test (Go)
See the Qodana documentation for language-specific configuration instructions.
Coverage metrics
Coverage is typically reported as a percentage of the code elements exercised during testing:
- Line coverage = executed executable lines ÷ total executable lines.
- Branch coverage = executed branches ÷ total branches.
Different metrics provide different levels of confidence. Line coverage indicates which code was executed, while branch coverage reveals whether every decision path has been tested.
Measuring Code Coverage involves using tools that analyze executed parts of the source code, then surfacing those results where developers can act on them-in pull request comments, IDE plugins, or CI dashboards. Exact coverage calculations can vary slightly between tools and languages, but line and branch coverage are the most commonly used metrics.

Understanding coverage percentages and “good” Code Coverage
Headline coverage numbers can be misleading if taken alone. A project at 85% line coverage might still have only 55% branch coverage, leaving complex logic undertested. Coverage metrics provide insights into test execution rather than test quality. A test that runs every line but asserts nothing offers a false sense of security.
So what counts as good coverage? Here are practical guidelines:
- Google considers 60% acceptable and 90% exemplary for Code Coverage across their projects.
- Developer consensus suggests aiming for 70% to 80% coverage to balance quality and avoid over-engineering.
- A study found average Code Coverage of 74-76% across 47 projects, suggesting most teams land in a similar range.
- UJET maintained an 85% Code Coverage requirement using a tool for visibility and trend tracking.
To many, aiming for 80% coverage is a healthy industry standard for critical business logic. But 100% Code Coverage does not guarantee bug-free code-it just means every line was touched, not that every behavior was validated.
Set thresholds by risk level:
- Financial transaction modules, authentication flows → 85–90%
- General business logic → 70–80%
- Generated or boilerplate code → exclude from thresholds entirely
Treat coverage as a trend indicator over time (week over week, sprint over sprint) rather than a one-off target. High coverage data indicates risks associated with legacy or untested code when numbers start dropping. Dashboards that visualize this trend help teams spot regressions before they compound.
How to improve Code Coverage without sacrificing quality
To improve Code Coverage meaningfully, treat it as a practical playbook, not an abstract goal. Here’s a step-by-step approach that keeps software quality front and center.
1. Start with your coverage reports. Use coverage reports to identify untested code sections, focusing on high-risk, low Code Coverage areas like core domain services, payment processing, and data access layers. Don’t try to raise the global coverage percentage uniformly.
2. Write focused unit tests first. Unit tests help quickly increase Code Coverage because they target isolated, pure functions and small components. Use frameworks like JUnit 5, pytest, or Jest to write additional tests around functions with the highest business impact.
3. Target uncovered branches and conditions. Line coverage remains the most common way to measure how much of a codebase is exercised by automated tests. However, you can look beyond it. Write test cases that exercise error paths, retry logic, timeout handling, and edge cases in complex logic. This will increase Code Coverage at the branch and condition level, where bugs most often hide.
4. Refactor overly complex code. Functions with very high Cyclomatic Complexity are hard to test and hard to cover. Splitting them into smaller, testable units improves both coverage numbers and static analysis findings.
5. Handle hard-to-test code. For third-party integrations, legacy modules, or code with heavy I/O, use dependency injection, mocking, test doubles, and contract testing. These strategies make writing tests possible without requiring full external environments.
6. Integrate coverage checks into CI. Integrate Code Coverage tools into your CI pipeline and set the goal to 80%, then track your progress. Enforce “no significant coverage regressions per pull request” using coverage status checks on GitHub, GitLab, or Azure DevOps.
7. Set realistic coverage goals based on project criticality. Not every file deserves the same target. Set coverage goals per module rather than globally.
Avoid writing superficial tests solely to push the coverage percentage up. Useful tests should assert meaningful behavior, edge cases, and error conditions – not just execute lines of code.
Code Coverage improves code reliability by verifying critical paths and logic, but only when the tests themselves are meaningful. Code coverage strengthens quality assurance by measuring test thoroughness, not by padding numbers.
Integrating Code Coverage with static analysis and CI/CD workflows
Combining coverage tools with static code analysis platforms gives you a more complete picture of code health: runtime execution metrics plus structural and style checks across multiple languages and programming languages.
Report overview
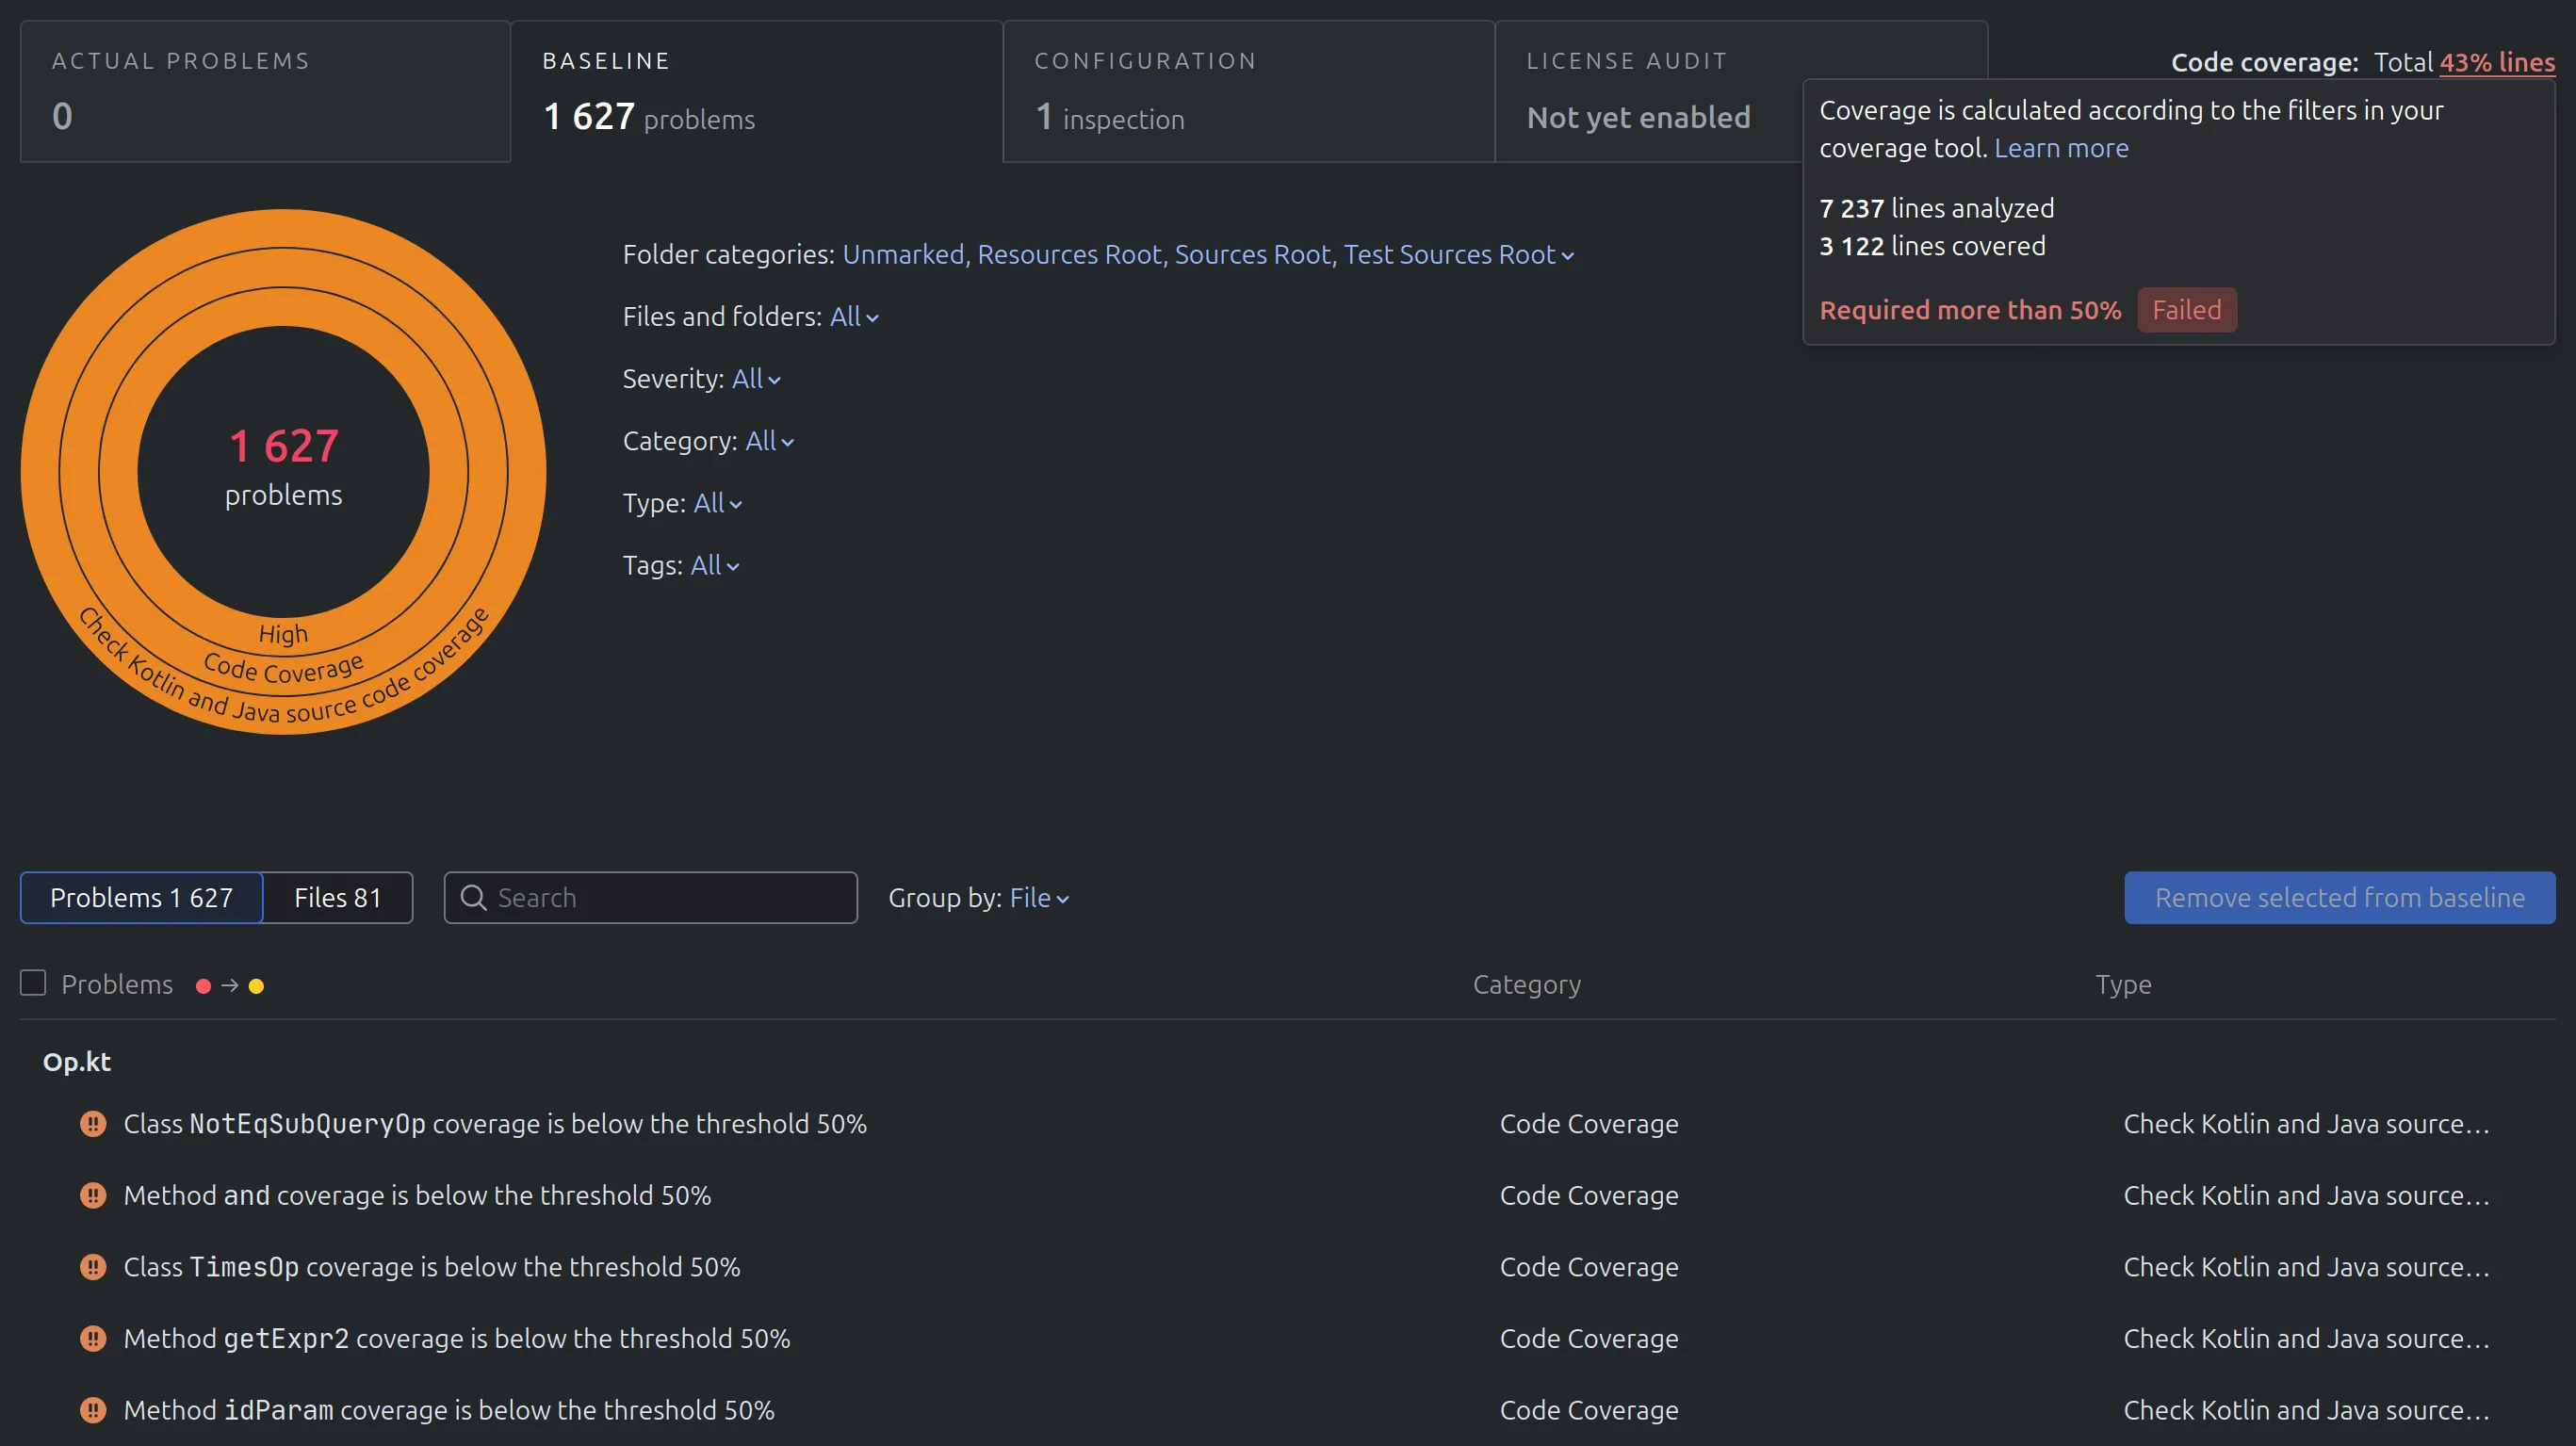
After you have prepared the project and run the Code Coverage, you can view Code Coverage reports in Qodana Cloud or using your IDE.
Qodana Cloud
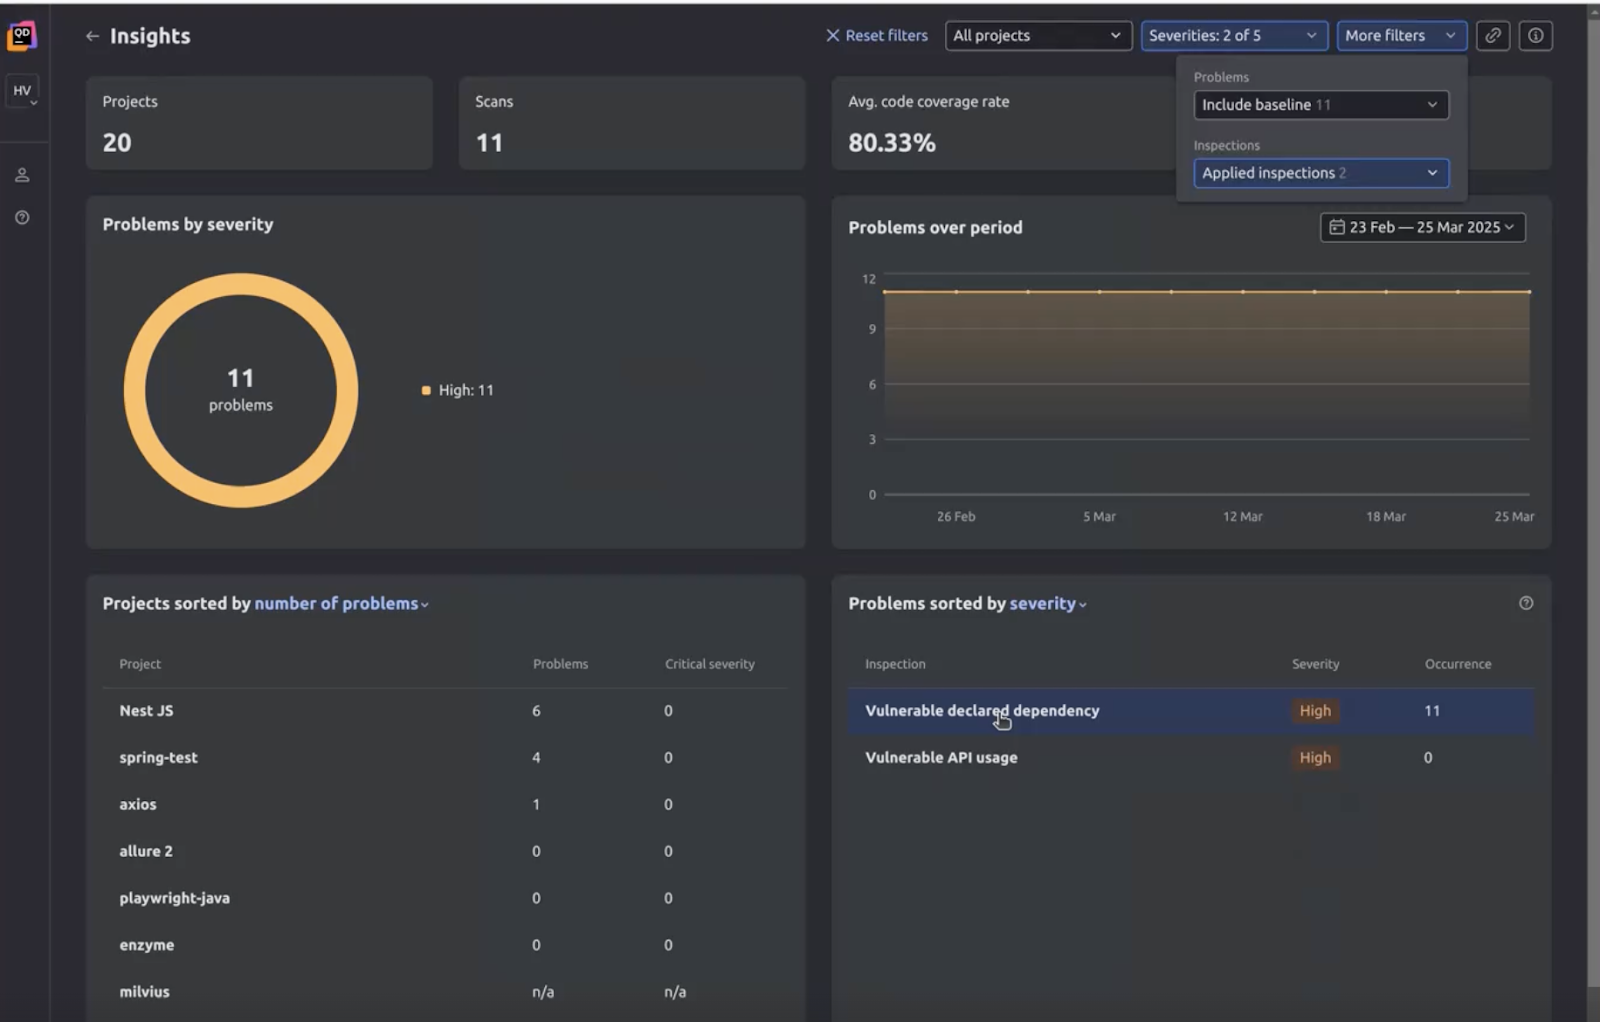
You can find Code Coverage statistics in the upper-right corner of the Qodana report UI. It also lists the inspections used by the feature.
IDE
You can view Code Coverage reports using IntelliJ IDEA, WebStorm, PhpStorm, PyCharm, and GoLand IDEs. This feature is available for reports retrieved from Qodana Cloud after linking, or reports from local storage.
Currently, Code Coverage overview is not available for XML-formatted reports generated by .NET coverage reports.
Open reports from Qodana Cloud
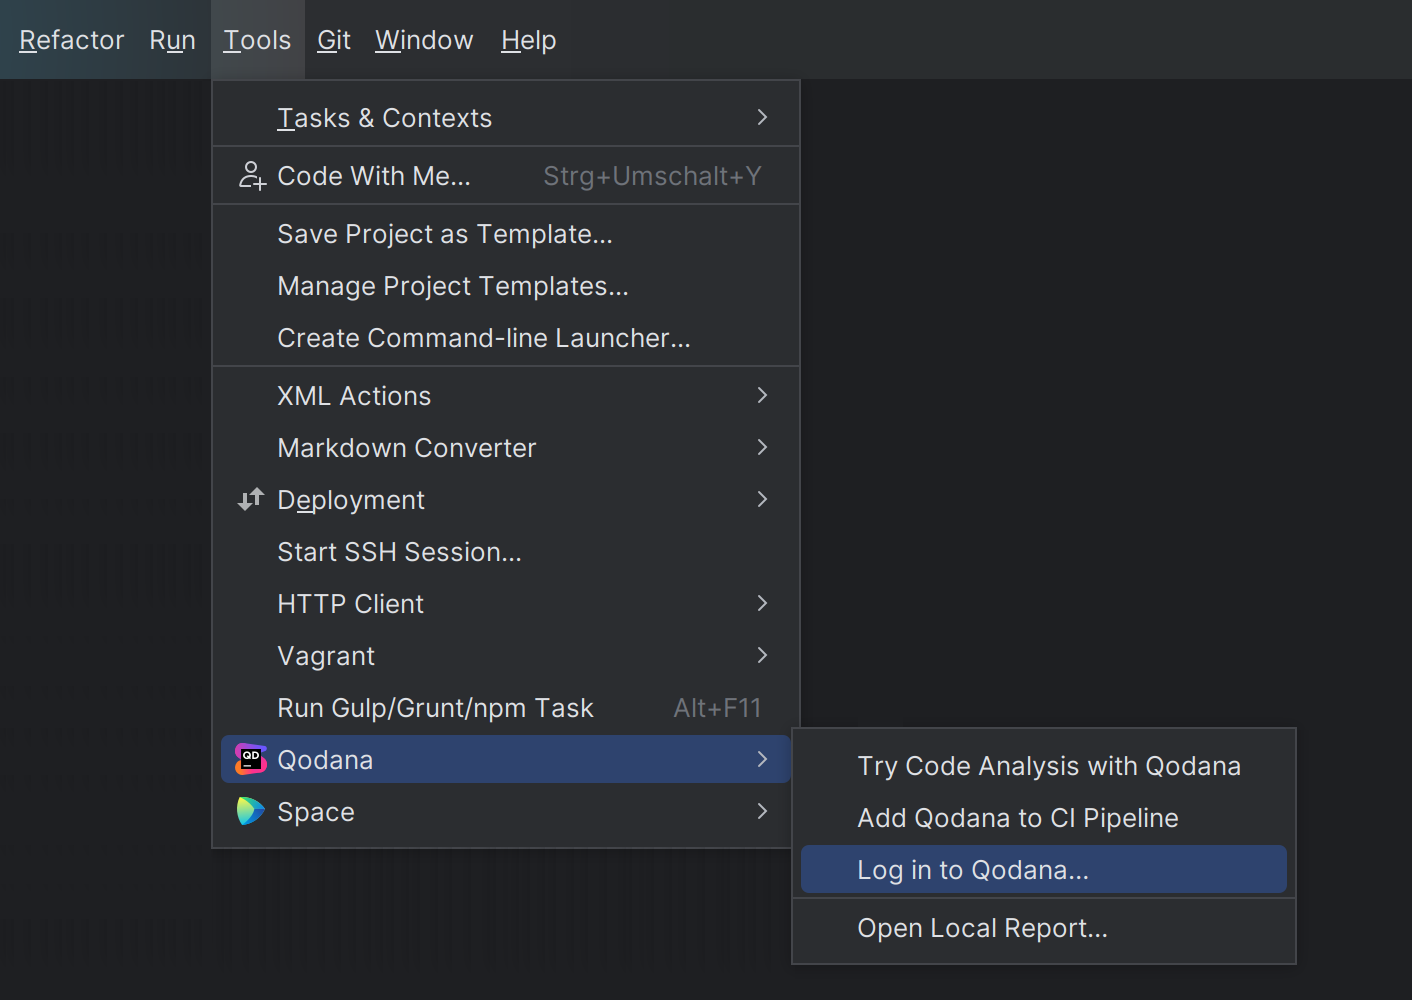
- In your IDE, navigate to Tools | Qodana | Log in to Qodana.
- On the Settings dialog, click Log in.
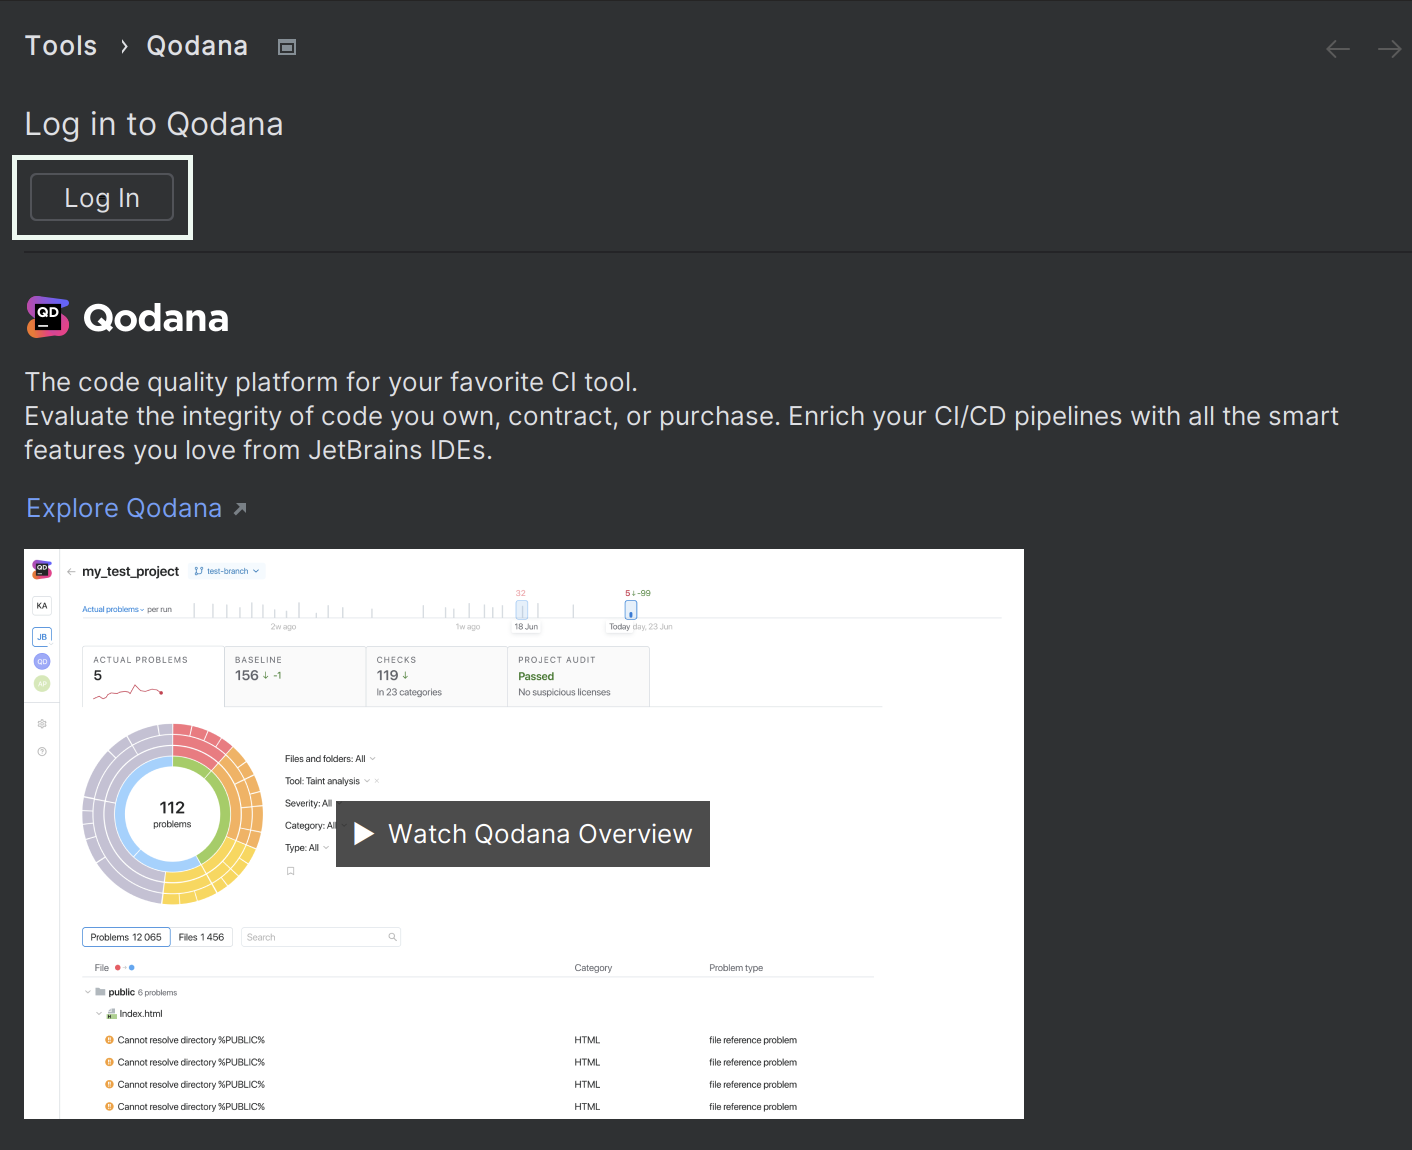
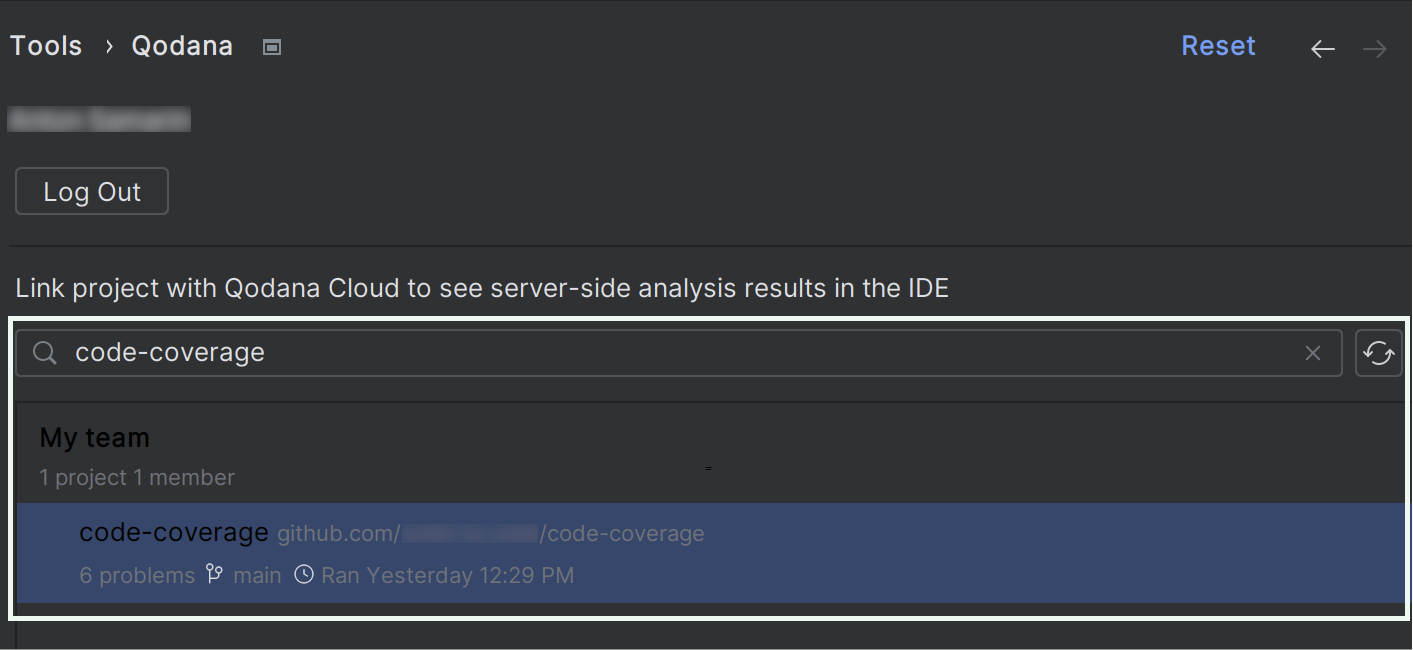
This will redirect you to the authentication page. - In the Settings dialog, search for the project you would like to link with.
View coverage reports in IDE
You can view code coverage reports based locally using JetBrains IDEs.
In your IDE, navigate to Run | Show coverage data and open the file containing a code coverage report.
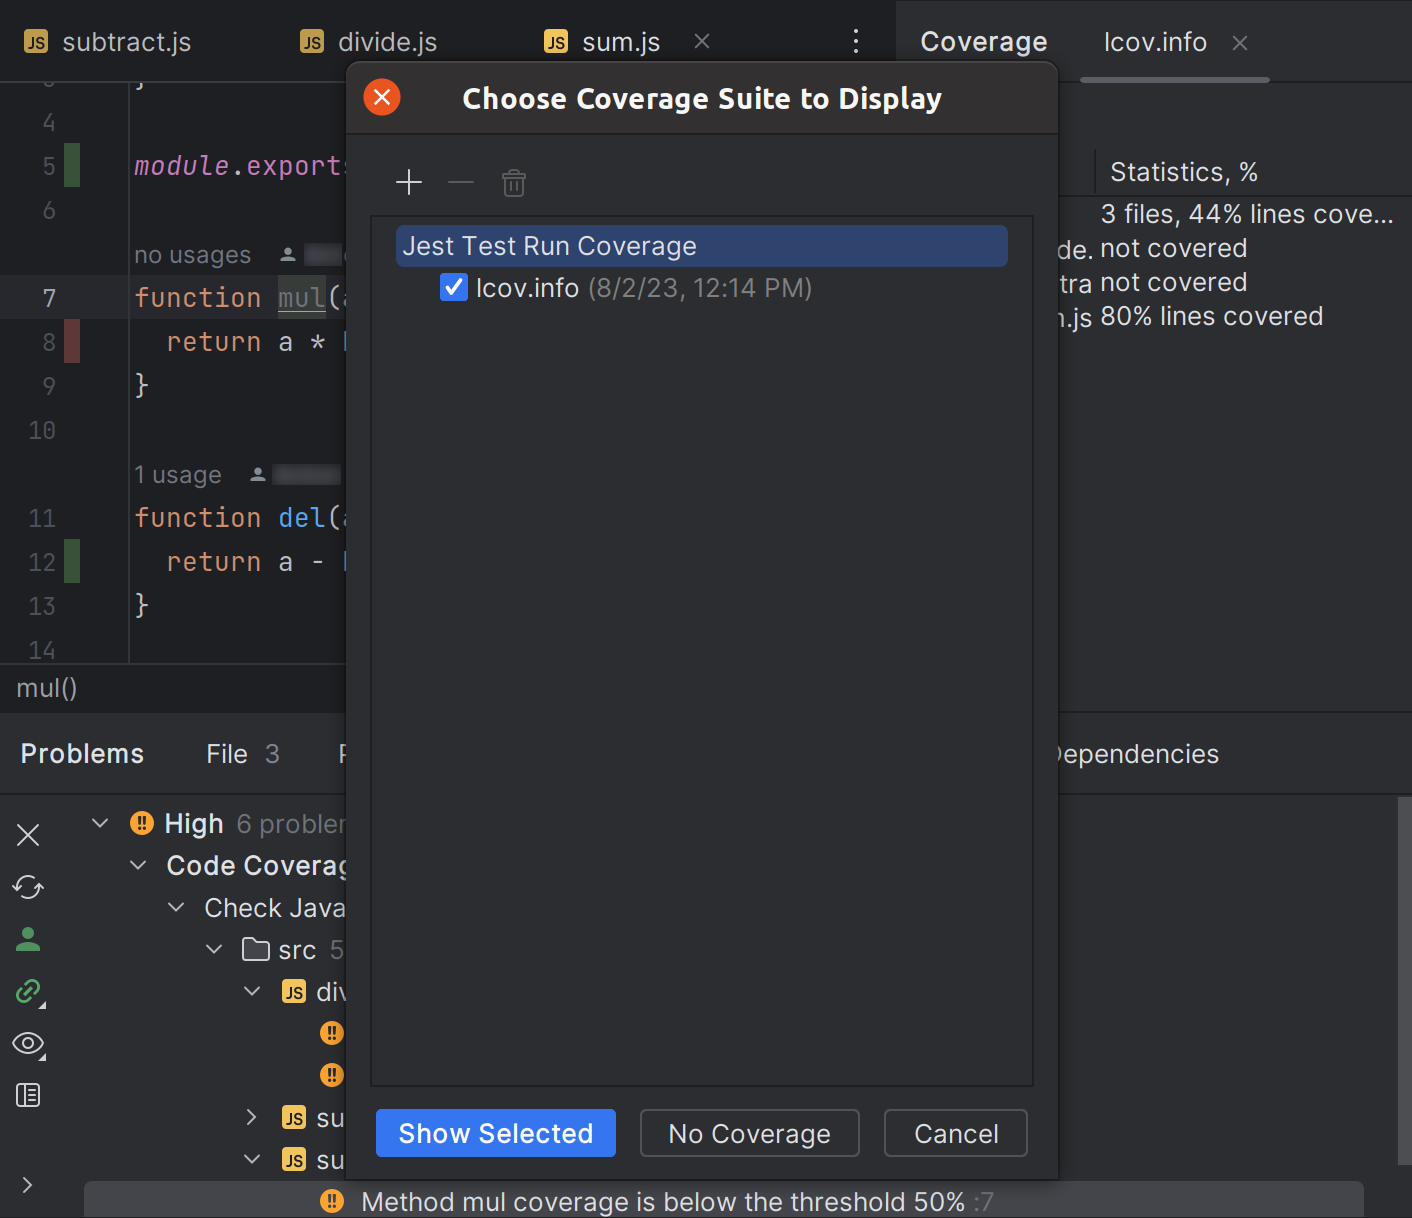
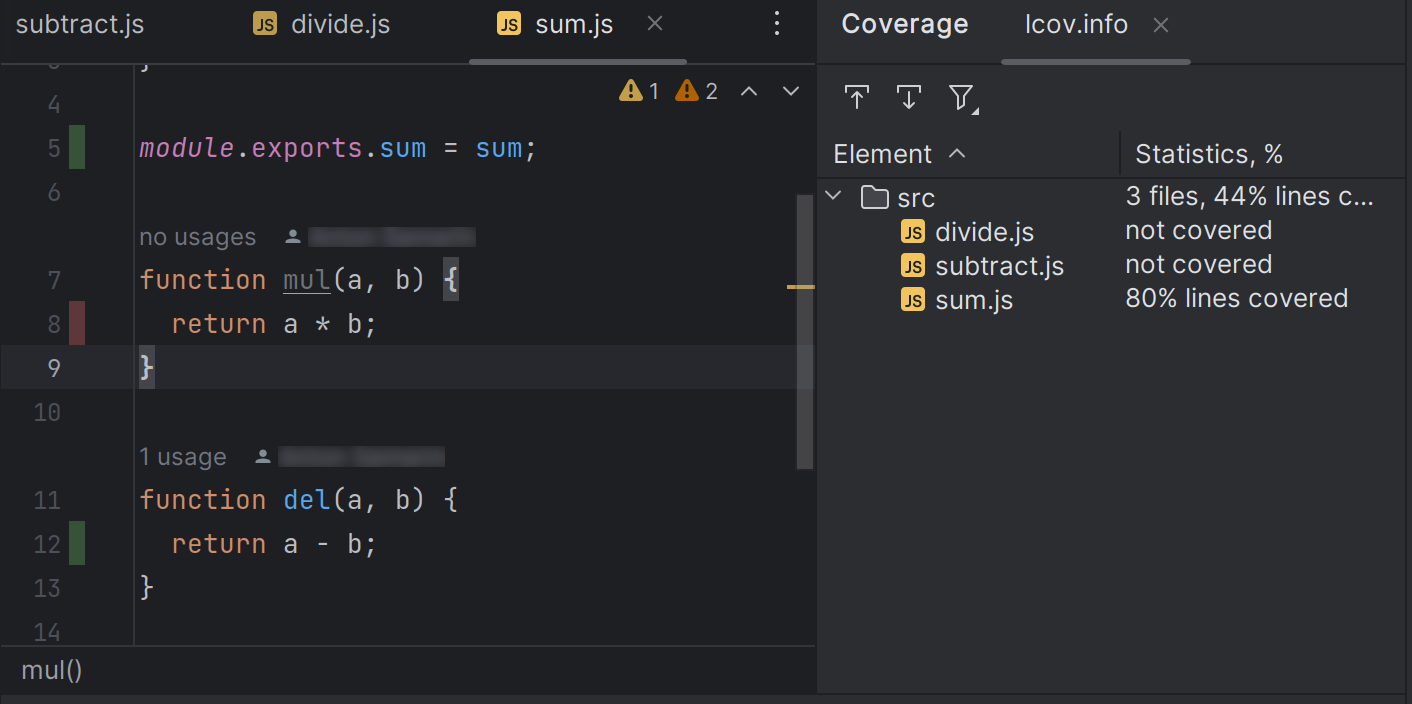
In the Coverage tool window, you can view the test coverage report. This report shows the percentage of the code that has been executed or covered by tests.
Report overview
The IDE highlights the codebase test coverage using color marking. By default, the green color means that a particular line was covered, and the red color means the uncovered line of code.
If you see that code coverage results look incomplete, you probably need to reconfigure your code coverage tool and generate a new code coverage report.
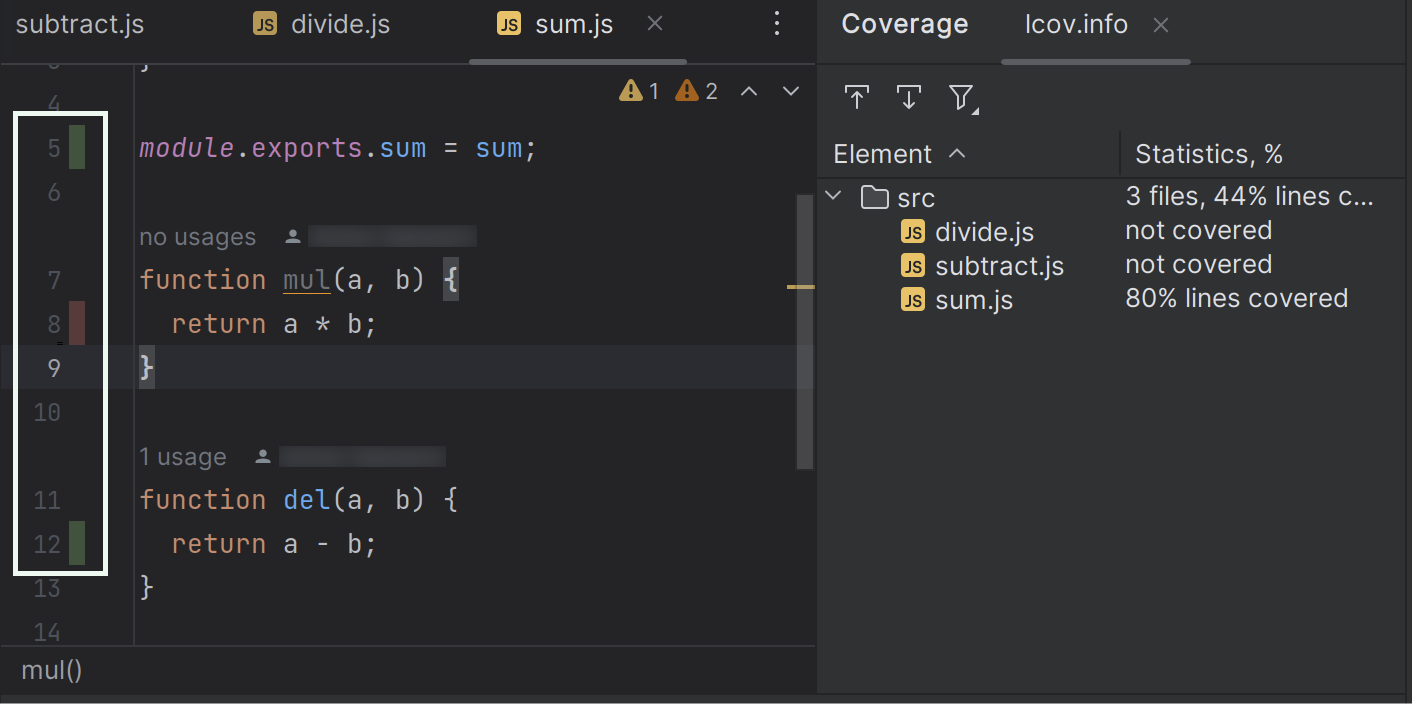
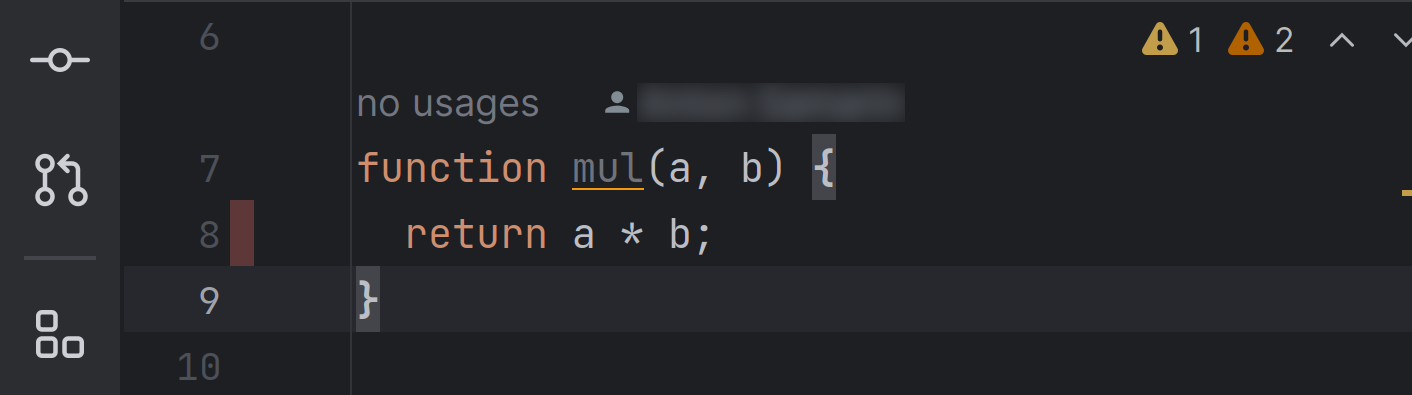
The report shows coverage for the lines that implement the logic of a method, function, or a class, but not for the function, method, or class declaration. The image below shows that code coverage is not applicable to line 7, while line 8 is not covered.
With Qodana, you can view Code Coverage in your Insights Dashboard.
FInd out more about Code Coverage and other features here.
Common pitfalls and misconceptions about high Code Coverage
High code coverage may provide a false sense of security. Consider a test suite with 100 code coverage on line coverage: if assertions are weak or missing entirely, serious bugs can slip through undetected. Execution alone isn’t validation.
Pitfalls to watch for:
- Completely ignoring other types of coverage. Qodana supports both overall line coverage and fresh lines coverage, allowing teams to focus on ensuring that newly added or modified code is properly tested while gradually improving coverage across the rest of the codebase. However, we encourage you to explore other types over time, such as branch coverage.
- Using coverage as a performance metric. When a single global coverage percentage becomes a team KPI, it incentivizes maintaining tests that are superficial-just enough to hit the number. This can slow the development process without meaningful benefit.
- Forcing coverage on untestable code. Generated code, trivial getters/setters, and framework glue are legitimately unnecessary to test. Trying to force coverage here wastes effort. Exclude these from thresholds.
- Forgetting what coverage doesn’t measure. Coverage tools do not evaluate whether all business requirements, user journeys, or non-functional aspects (performance, security, usability) are adequately tested. They only report which code was executed.
Microsoft Research examined 100+ large open-source Java projects and found insignificant correlation between high coverage and fewer post-release defects at the file level. This reinforces that coverage is necessary but not sufficient-balance it with defect trends, incident postmortems, static analysis warnings, and production monitoring.
FAQ
Is 100% code coverage ever required in real projects?
Yes, in safety-critical domains. Aerospace software under DO-178C and automotive systems under ISO 26262 can require near-100% statement, branch, and MC/DC coverage based on one or more criteria tied to safety integrity levels. For most commercial web and mobile applications, 80% code coverage is generally considered a good goal for core modules, with diminishing returns beyond that. Test quality and risk-based focus matter more than chasing 100% across the entire code base.
How often should I run coverage analysis in my project?
Run coverage on every pull request in active repositories so regressions are caught immediately. For large software projects with slower integration and end-to-end existing tests, schedule a nightly or weekly full-coverage job. Use the trend data to guide refactoring investments and determine where additional tests are most needed.
Which coverage metric should I prioritize first: line, branch, or something else?
Start with line coverage as a simple baseline that’s easy to communicate to stakeholders. Once your team is comfortable, introduce branch coverage as the primary metric for non-trivial business logic. Condition Coverage and Path Coverage are most useful in particularly complex, risk-heavy code-authorization checks, pricing engines, or any program with deeply nested control structures-and can be adopted selectively rather than project-wide.
How do static code analysis and code coverage complement each other?
Static analysis flags potential problems without running the code, including dead code, null dereferences, security smells. Code coverage shows which parts of the source code are actually exercised by tests. Together they create a feedback loop: static analysis identifies complex or risky areas, coverage reports reveal whether they’re adequately covered, and developers prioritize new tests or refactors accordingly.
Can I use code coverage for manual tests or only for automated tests?
Coverage tools work with automated tests by default, but they can also collect data while manual exploratory tests run against an instrumented application. This is useful during pre-release hardening phases to confirm which functionality was exercised. The most valuable manual scenarios can then be converted into automated tests to preserve that coverage over time across your software projects.
Note: While examples in this article use specific coverage tools, Qodana isn’t tied to any particular solution. Any tool that produces a supported coverage report format can be used.
Special thanks to Andrei Iurko and Ivan Efiminov for their assistance with this post.
Subscribe to Qodana Blog updates
0 Comments
Log in to join the conversation.No comments yet. Be the first to share your thoughts.