

NVIDIA OptiX ray tracing engine is an application framework for achieving optimal ray tracing performance on the GPU. Applications using OptiX can fail in ways that are difficult to diagnose: an invalid API argument, a black frame, or a GPU-side bug buried under thousands of concurrent threads.
Debugging facilities in the NVIDIA OptiX Toolkit (OTK) can help. OTK is a GitHub repository containing a set of utilities supporting workflows common in GPU ray tracing applications. OTK is licensed with a BSD 3-clause style license, so you are free to copy and modify any of the code.
This post covers two OTK debugging facilities: consistent checking of OptiX and CUDA API error codes and targeted device-side debug printing. OTK includes an example program, DemandPbrtScene, that shows device-side debug printing used in context.
How do OptiX logging and validation work?
Before getting to the assistance provided by OTK, some background on the OptiX log would be useful. When you create an OptiX device context, you supply an options structure that allows you to configure a log callback and a validation mode. OptiX can assist in validating inputs to API functions when the validation mode is set to OPTIX_DEVICE_CONTEXT_VALIDATION_MODE_ALL.
OptiX writes human-readable messages for validation errors to the log. The log output should be the first place you look for API errors like OPTIX_ERROR_INVALID_VALUE. Validation does impose some additional cost in the API. It’s recommended to enable all validation in debug and testing builds and omitting validation for release builds. For more details, see the OptiX SDK samples.
How to consistently check return codes for errors
It’s best to detect errors as early as possible as detailed in this section, before subsequent failures mask the original problem.
API mechanisms
Most functions in OptiX return an OptixResult error code that, when non-zero, indicates an error. The CUDA runtime API and the CUDA driver API follow a similar pattern. All three APIs support the following:
- A distinct enumerated type for the error code; for example
OptixResult - A function to return a symbolic name for an error code as a string; for example
OPTIX_ERROR_INVALID_VALUE - A function to return a human-readable error message for an error code; for example,
Invalid value
The signatures of these functions are slightly different for the three APIs, but the mechanisms are the same.
Error checking policy
Handling these error codes manually at every API call site is tedious and error-prone. It is better to use macros or function calls to enforce a consistent policy for handling errors. OTK provides macros that implement two policies when an error is detected:
OTK_ERROR_CHECK( expr ): Throw an exceptionOTK_ERROR_CHECK_NOTHROW( expr ): Print a message tostd::cerrand continue
Other policies are easily implemented by reusing some of the provided machinery and creating an appropriate macro.
Minimal use of macro machinery
This error checking mechanism uses macros to a minimal extent and delegates to inline functions to do the actual work. You can set breakpoints in the inline function definitions to have the debugger stop execution when the function detects an error.
The macros exist to provide diagnostic information about the code that caused the error:
expr: A string form of the supplied argument to the macro. This is the expression that evaluates to the error code.__FILE__: The name of the source file where the macro was invoked.__LINE__: The line number within the source file where the macro was invoked.
This information from the macro call site is passed to the inline function that does the actual error checking.
Unified error checking across APIs
The inline template function checkError checks the status code for an error and creates a diagnostic message if it detects a failure. In the case of these three APIs, a simple cast of the error code to bool suffices to indicate an error. All three APIs use a status code of zero to indicate success and non-zero to indicate failure.
Error messages are formatted as follows:
file(line): expr failed with error nnn (name): message
Where expr is the evaluated expression, nnn is the result of casting the status code to an int, name is the symbolic name of the status code, and message is the human-readable error message. If either the name or message are empty, the function omits them.
The inline template function makeErrorString is responsible for building this message. It calls the inline template functions getErrorName and getErrorMessage to build the combined message.
Each API has a distinct type for API status codes, so you can specialize the template functions to perform the appropriate API call to get the extended error information.
Usage
OTK provides one header per API that provides the necessary specializations of the template functions described (Table 1).
Simply include the headers for the APIs you are using and use the single macro OTK_ERROR_CHECK around all call sites. The following example uses all three APIs.
OTK_ERROR_CHECK( cudaSetDevice( m_deviceIndex ) );
OTK_ERROR_CHECK( cuCtxGetCurrent( &m_cudaContext ) );
OTK_ERROR_CHECK( cuStreamCreate( &m_stream, CU_STREAM_DEFAULT ) );
OTK_ERROR_CHECK( optixInit() );
How to perform targeted device-side debug printing
The problem with graphics applications is that there are too many ways to code up a black screen.
To debug problems in your OptiX device code, you can take several approaches. A couple of obvious choices spring to mind:
- Use the CUDA debugger on a debug build of the device code
- Get information from a release build of the device code with
printf
Many applications run too slowly when compiled in debug mode, impairing the use of interactive debuggers.
The main difficulty with printf-style debugging is that there are so many threads running concurrently on the GPU that you can end up drowning in a firehose of output. In addition, it could be that the issue only arises after a certain amount of interaction with the application. Debug output prior to the problem manifesting visually is just noise that gets in the way of finding the desired information.
DebugLocation
The header <OptiXToolkit/ShaderUtil/DebugLocation.h> provides a reusable mechanism for debug output. The structure DebugLocation controls the behavior:
struct DebugLocation
{
    bool  enabled;
    bool  dumpSuppressed;
    bool  debugIndexSet;
    uint3 debugIndex;
};
The enabled member turns the entire mechanism on or off. The dumpSuppressed member turns off the debug output even if the mechanism is enabled. The debugIndexSet member indicates that a valid launch index has been stored in debugIndex.
The mechanism will output debug information when the following conditions are true:
enabledis truedumpSuppressedis falsedebugIndexSetis true, and- The current launch index matches
debugIndex
Include an instance of the DebugLocation structure in the launch parameters of the OptiX pipeline for interactive control of debug output.
The debugInfoDump function
The template function debugInfoDump provides the interface for emitting debug information:
template <typename Callback>
static __forceinline__ __device__
bool debugInfoDump( const DebugLocation& debug,
                    const Callback &callback )
The Callback template parameter should be a struct or class matching the following:
struct Callback
{
    void setColor( float red, float green, float blue );
    void dump( const uint3& index );
};
The setColor method is used to draw a visual box around the debug location for easy identification of the point on the screen for which information is dumped. The typical usage is to set the color for the output pixel corresponding to the current launch index. If no visual indication of the debug location is desired, the method can simply be empty.
The dump method is used to print whatever information the application considers relevant at the supplied launch index.
Displaying the debug location
When enabled, the setColor method on the callback structure draws a box on screen to indicate the current debug location, even when dump output is suppressed. The box is hidden when disabled.
A red pixel at the debug location sits inside a one-pixel-wide black box, itself inside a one-pixel-wide white box. This provides a high-contrast indicator of the location where dump messages are occurring. If the output buffer is not a traditional color buffer, you are free to map the supplied red, green, and blue values to some distinctive value for visualization.
One-shot mode
To avoid drowning in debug output, it’s useful to have the debug output in a one-shot mode, where the output is dumped once in response to user control. You can sequence this mode as follows:
- Enable the
DebugLocationmechanism - Launch as usual
- When the user interactively selects the debug location, set
dumpSuppressedtotrue,debugIndexSettotrue, anddebugIndexto the selected location - Subsequent launches display the debug location, but the mechanism provides no dumps
- The user interacts with the application to manipulate it into the appropriate state, possibly moving the debug location along the way
- When the user indicates that they want debug information for the current location, set
dumpSuppressedtofalse - Launch to get the debug output
- Set
dumpSuppressedback totrueafter launch
DemandPbrtScene example
The DemandPbrtScene example in OTK demonstrates demand loaded geometry for pbrt version 3 scenes. It uses the DebugLocation mechanism, including one-shot behavior and interactive toggling of debug output and interactive selection of the debug position. It uses ImGui as the UI framework.
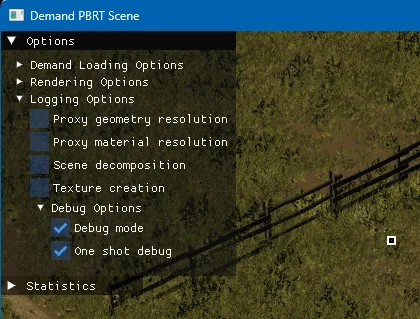
To run this example from OTK, you will need a scene file for pbrt-v3.
The OptiX Toolkit provides reusable debugging and testing utilities for common OptiX development problems: consistent API error checking and targeted device-side debug output. The code is available through the NVIDIA/optix-toolkit GitHub repo.
Ready to get started? Download the OptiX Toolkit from GitHub and start by enabling OptiX validation in your debug builds, wrapping your CUDA and OptiX calls with OTK_ERROR_CHECK, and using DebugLocation to isolate GPU-side bugs earlier in development. OTK is available under a permissive BSD 3-clause-style license, so you can copy, adapt, and integrate these utilities directly into your own OptiX applications.
0 Comments
Log in to join the conversation.No comments yet. Be the first to share your thoughts.