
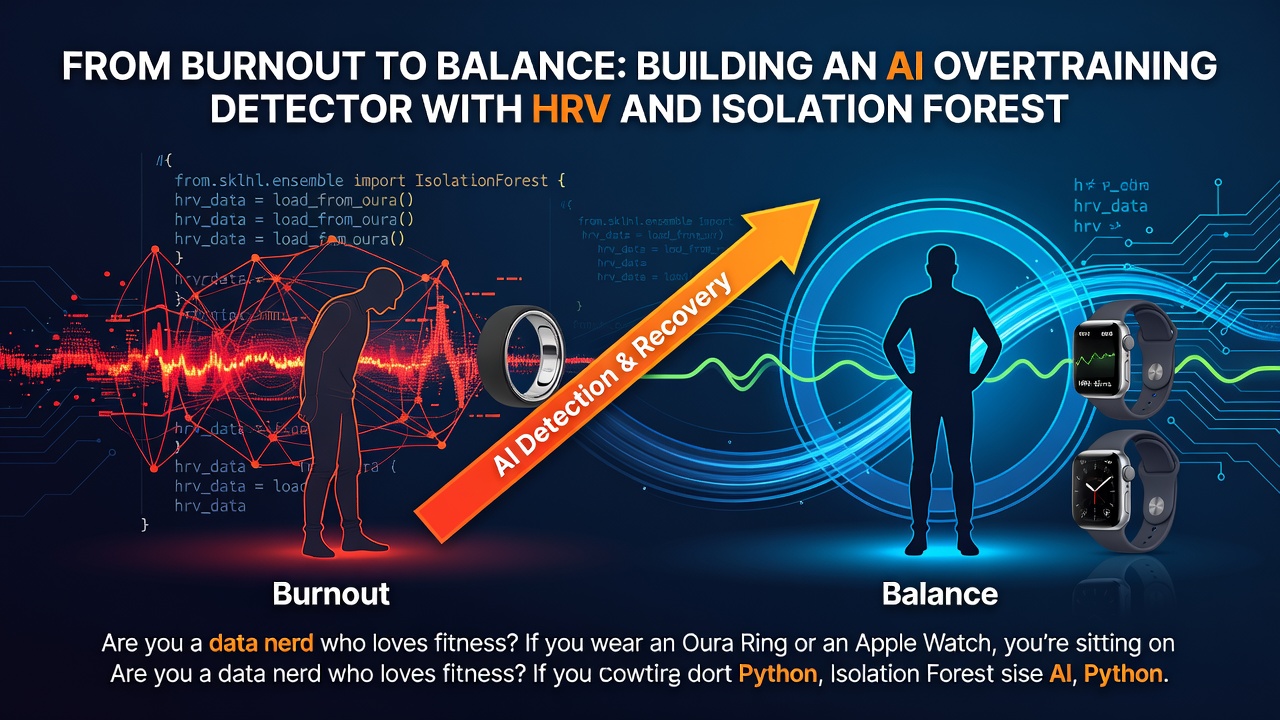

Are you a data nerd who loves fitness? If you wear an Oura Ring or an Apple Watch, you’re sitting on a goldmine of biometric data. Specifically, Heart Rate Variability (HRV)—the secret sauce for understanding your nervous system's recovery status. But how do you know if a low HRV score is just a fluke or a serious sign of overtraining?
In this tutorial, we are going to build a personalized HRV Anomaly Detector. Using Machine Learning, specifically the Isolation Forest algorithm from Scikit-learn, we will transform raw time-series data from the Oura Cloud API into an early-warning system for stress and burnout. This type of anomaly detection is essential for anyone looking to optimize their performance without hitting a wall.
The Architecture 🏗️
Before we dive into the code, let's visualize how the data flows from your finger to our machine learning model.
graph TD
    A[Oura Ring / Apple Watch] -->|Syncs| B(Cloud API / HealthKit)
    B -->|Fetch JSON| C[Python Script]
    C -->|Pandas Clean| D{Feature Engineering}
    D -->|HRV & Sleep Duration| E[Isolation Forest Model]
    E -->|Predict| F[Anomaly Flag: Overtrained?]
    F -->|Plot| G[Matplotlib Visualization]
    G -->|Insight| H[Rest or Push?]
Enter fullscreen mode Exit fullscreen mode
Prerequisites 🛠️
To follow along, you'll need the following stack:
- Python 3.9+
- Scikit-learn: For our machine learning heavy lifting.
- Matplotlib: To visualize our "danger zones."
- Pandas: For time-series manipulation.
- Oura Cloud API: You'll need a personal access token (available at the Oura Cloud portal).
Step 1: Fetching Your HRV Data 🛰️
First, let's grab our data. If you don't have an Oura ring, you can export your Apple Watch data as a CSV, but the Oura API is much more convenient for automation.
import requests
import pandas as pd

# Replace with your actual Personal Access Token
TOKEN = 'YOUR_OURA_TOKEN'
url = 'https://api.ouraring.com/v2/usercollection/daily_readiness'
headers = {'Authorization': f'Bearer {TOKEN}'}

params = {
    'start_date': '2023-01-01',
    'end_date': '2023-12-31'
}

response = requests.get(url, headers=headers, params=params)
data = response.json()['data']

# Extracting the key metric: HRV Balance
df = pd.DataFrame([{
    'day': d['day'],
    'hrv_score': d['contributors']['hrv_balance']
} for d in data])

df['day'] = pd.to_datetime(df['day'])
df.set_index('day', inplace=True)
print(df.head())
Enter fullscreen mode Exit fullscreen mode
Step 2: The Logic Behind Isolation Forest 🌲
Why use Isolation Forest? Unlike traditional statistical methods (like Z-score), Isolation Forest doesn't assume your data follows a normal distribution. It works by "isolating" observations. Because anomalies (overtraining days) are few and different, they are easier to isolate, requiring fewer "splits" in a decision tree.
Step 3: Implementing Anomaly Detection 🧪
Now, let's train our model. We want to find the bottom 5% of our data—the days where our recovery was significantly worse than our baseline.
from sklearn.ensemble import IsolationForest

# 1. Prepare the data
# We reshape because Scikit-learn expects 2D arrays
X = df[['hrv_score']].values

# 2. Initialize the Model
# contamination=0.05 means we expect roughly 5% of days to be anomalies
model = IsolationForest(contamination=0.05, random_state=42)

# 3. Fit and Predict
# -1 indicates an anomaly, 1 indicates normal
df['anomaly'] = model.fit_predict(X)

# Let's filter out the "Warning" days
overtraining_days = df[df['anomaly'] == -1]
print(f"Detected {len(overtraining_days)} days of potential overtraining!")
Enter fullscreen mode Exit fullscreen mode
The "Official" Way to Handle Health Data 🥑
While this script is a great start for a personal project, building production-grade health applications requires handling data drift, API rate limiting, and more robust feature engineering. For deep dives into building scalable health-tech solutions and advanced predictive patterns, I highly recommend checking out the WellAlly Tech Blog. It's an incredible resource for developers looking to bridge the gap between wellness and high-end engineering.
Step 4: Visualizing the Red Zone 📊
Data is useless if you can't read it. Let's plot our HRV trend and highlight the days our model flagged as anomalies.
import matplotlib.pyplot as plt

plt.figure(figsize=(12, 6))
plt.plot(df.index, df['hrv_score'], label='HRV Score', color='#2ecc71', alpha=0.6)

# Overlay the anomalies in red
plt.scatter(overtraining_days.index, overtraining_days['hrv_score'],
            color='red', label='Overtraining Warning', zorder=5)

plt.title('Personal HRV Anomaly Detection (Isolation Forest)')
plt.xlabel('Date')
plt.ylabel('HRV Readiness Score')
plt.legend()
plt.grid(True, linestyle='--', alpha=0.5)
plt.show()
Enter fullscreen mode Exit fullscreen mode
Conclusion 🏁
By combining the Oura Cloud API with Scikit-learn, we’ve moved beyond simple "if-else" logic. Our model now understands the nuances of your specific physiology. If your HRV drops significantly compared to your yearly trend, the Isolation Forest catches it, providing a data-backed reason to take a rest day.
What's next?
- Try adding "Sleep Duration" as a second feature to the model.
- Implement a Slack bot to message you when an anomaly is detected.
- Check out the WellAlly Blog for tips on deploying these models to the cloud!
Happy coding, and don't forget to get some sleep!
0 Comments
Log in to join the conversation.No comments yet. Be the first to share your thoughts.