
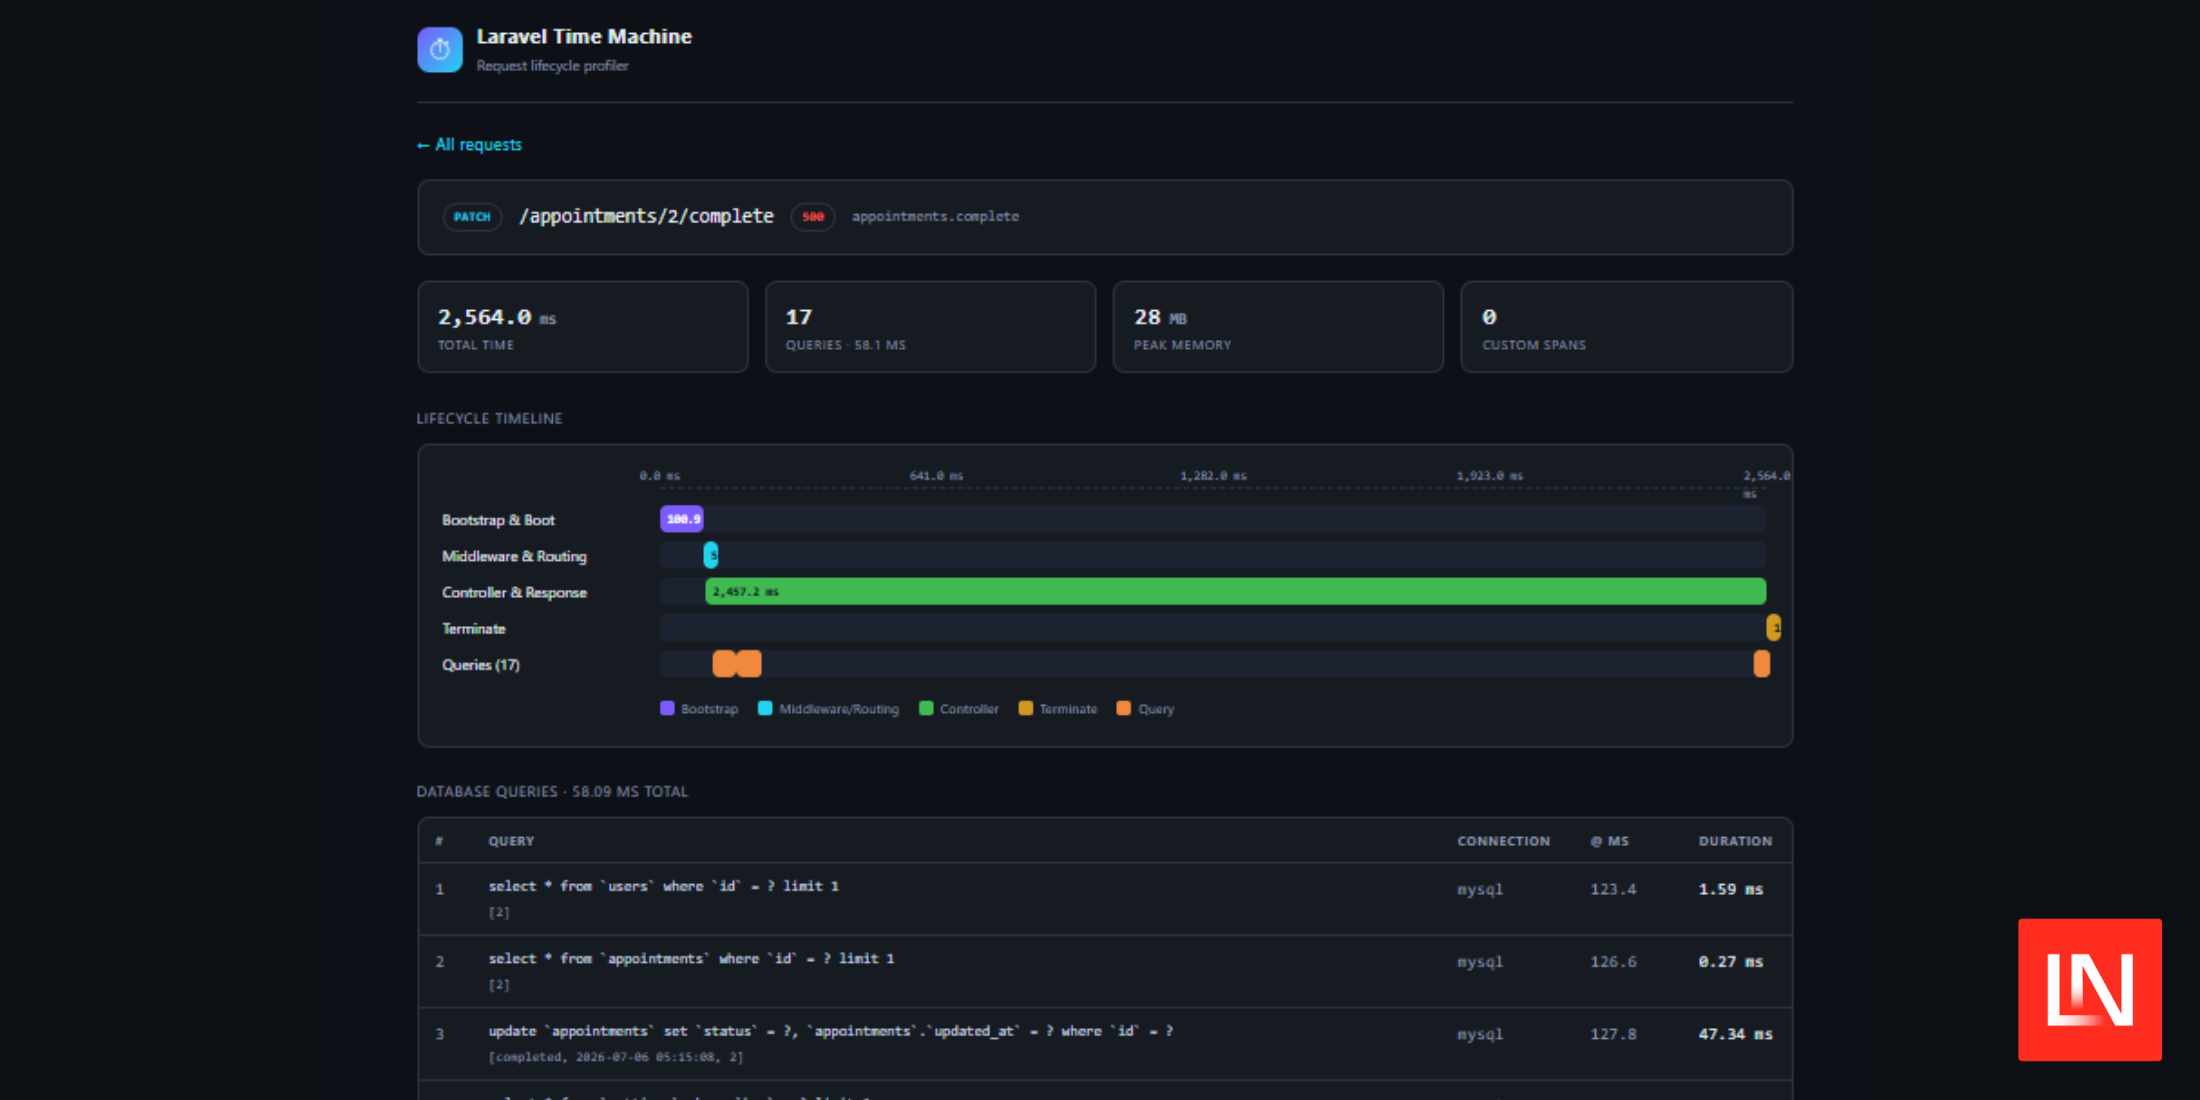
Laravel Time Machine is a performance profiler by Jaydeep Gadhiya that records every stage of a Laravel request — bootstrap, middleware, routing, controller, response, and termination — with millisecond timings. It answers one question: where did the time go in this request?
Here's what the package gives you:
- Lifecycle timeline — a Gantt-style breakdown of each request phase, from framework boot through the
terminatestep. - Query capture — every SQL statement with bindings, connection, and execution time, toggled via
collectors.queries. - Slow highlighting — requests over 500ms and queries over 50ms get flagged, with both thresholds configurable.
- Flat-file storage — profiles are plain JSON files in
storage/time-machine; no database tables or migrations. - Ignore patterns — asset requests and paths like the Telescope dashboard are skipped via
ignore_paths. - Debug-only by default — the profiler follows
APP_DEBUG, so it stays off in production unless you enable it.
The Timeline Dashboard
Once installed, the package records every HTTP request automatically and serves a self-contained dashboard at /time-machine when enabled. Each request gets a visual timeline showing how long the application spent in each lifecycle phase, alongside memory usage and query counts. Requests that cross the slow threshold (500ms by default) are highlighted so bottlenecks stand out in the list of recent profiles.
Custom Instrumentation
Beyond the automatic lifecycle phases, you can instrument your own code through the TimeMachine facade. Drop point-in-time markers, wrap a block in a measured closure, or control spans manually:
use Jaydeep\LaravelTimeMachine\Facades\TimeMachine;
// Drop a marker on the timeline
TimeMachine::mark('cache primed');
// Time a code block
$report = TimeMachine::measure('generate-report', function () {
return Report::build();
});
// Manual span control
TimeMachine::startSpan('external-api');
$response = Http::get('https://api.example.com');
TimeMachine::endSpan('external-api');
Custom spans appear on the same timeline as the framework phases, so you can see how a slow external API call or report generation fits into the overall request.
Storage Without a Database
Profiles are written as JSON files to storage/time-machine, which means there are no migrations to run and the data never leaves your server. The package retains the most recent 100 profiles by default and prunes the oldest ones as new requests come in; the storage.max_records setting (or the TIME_MACHINE_MAX_RECORDS env variable) adjusts the limit.
How It Compares to Telescope and Debugbar
There's some overlap with Laravel Telescope and Laravel Debugbar, but the three tools have different scopes. Telescope monitors many parts of an application — requests, jobs, mail, notifications, cache, and more — and stores its entries in the database.
Debugbar renders a toolbar inside the current page with timing and query data for that response.
Time Machine sits in between: it keeps a browsable history of recent requests like Telescope, but collects only lifecycle timing and query data, stores it in flat files, and presents it on a timeline. If you want full application monitoring, Telescope is still the better fit; if you're profiling where individual requests spend their time, that's the case this package is built for.
Installation and Configuration
The package supports Laravel 8 through 13, and installs via Composer with auto-discovery handling the service provider and facade:
composer require jaydeep/laravel-time-machine
Publishing the config file is optional:
php artisan vendor:publish --tag=time-machine-config
You can learn more about this package, get full installation instructions, and view the source code on the laravel-timemachine GitHub repository.
0 Comments
Log in to join the conversation.No comments yet. Be the first to share your thoughts.