
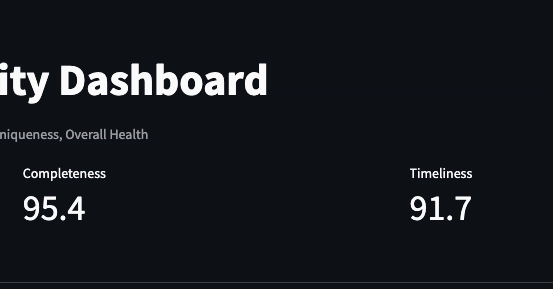


If you've ever wanted to try Databricks Apps but weren't sure where to start, this is the walkthrough I wish I'd had. I built a small data-quality dashboard from scratch using simulated data, a Streamlit UI, and deployed it straight from GitHub and open-sourced the whole thing so you can clone it and adapt it for your own use case.
Repo: [https://github.com/Lanre2907/data-observability-sample.git]
Why this project
Data observability: tracking completeness, timeliness, uniqueness, and overall health of your tables is something most data teams eventually need a dashboard for. Rather than write about it abstractly, I built the smallest possible working version: a Streamlit app reading from a simulated CSV, deployed as a real Databricks App.
The goal wasn't a production tool. It was a clean, minimal reference for the mechanics of getting a data app running on Databricks. Something you could fork in ten minutes and start editing.
What it does
The dashboard shows:
KPI tiles for the latest day — Overall Health, Completeness, Timeliness, Uniqueness
A trend chart you can toggle between metrics, broken out by table
A snapshot table of the latest scores across all tracked tables
The data itself is generated by a small script that random-walks scores around a baseline per table, so the trends look realistic without touching any real system.
Project structure
data-observability-sample/
├── app.py # Streamlit dashboard
├── app.yaml # Tells Databricks Apps how to run the app
├── requirements.txt # Python dependencies
├── generate_sample_data.py # Generates the simulated dataset
└── data/
└── dq_metrics.csv
Nothing exotic — just pandas, streamlit, and plotly.
Deploying it: the Git route
Databricks Apps supports deploying straight from a workspace folder, but I wanted the Git-linked flow since it mirrors how you'd actually manage this in a team setting.
Push the repo to GitHub.
In the Databricks workspace: Compute → Apps → Create app → Create a custom app.
In the Configure Git step, point it at the repo URL and branch (main).
If the repo is private, add a Git credential (a GitHub PAT with repo scope).
Click Create app, then Deploy.
Databricks pulls the repo, reads app.yaml, installs requirements.txt, and starts the app. The deployment log is genuinely satisfying to watch the first time — source pulled, packages installed, app built, app started, done.
Once it's running, you get a live URL like:
[https://data-observability-app-7474646500738457.aws.databricksapps.com/]
What I'd extend next
The obvious next step is swapping the static CSV for a real source pointing app.py at a Databricks SQL warehouse or a Delta table via the Databricks SDK instead of pandas.read_csv. The dashboard code doesn't need to change at all as long as the resulting DataFrame keeps the same columns.
If you're learning Databricks Apps and want a minimal, no-surprises starting point, feel free to fork this and rip out the parts you don't need. PRs welcome if you extend it in an interesting direction.
If this was useful, I'd appreciate a star on the repo and let me know what you build with it.
0 Comments
Log in to join the conversation.No comments yet. Be the first to share your thoughts.