


I run a public board that probes 16 LLMs on a frozen 35-task suite, once a day, and keeps every score. When a model drops against its previous run, it opens a GitHub issue by itself and writes me a draft post.
Between 21 and 24 July it did that four times:
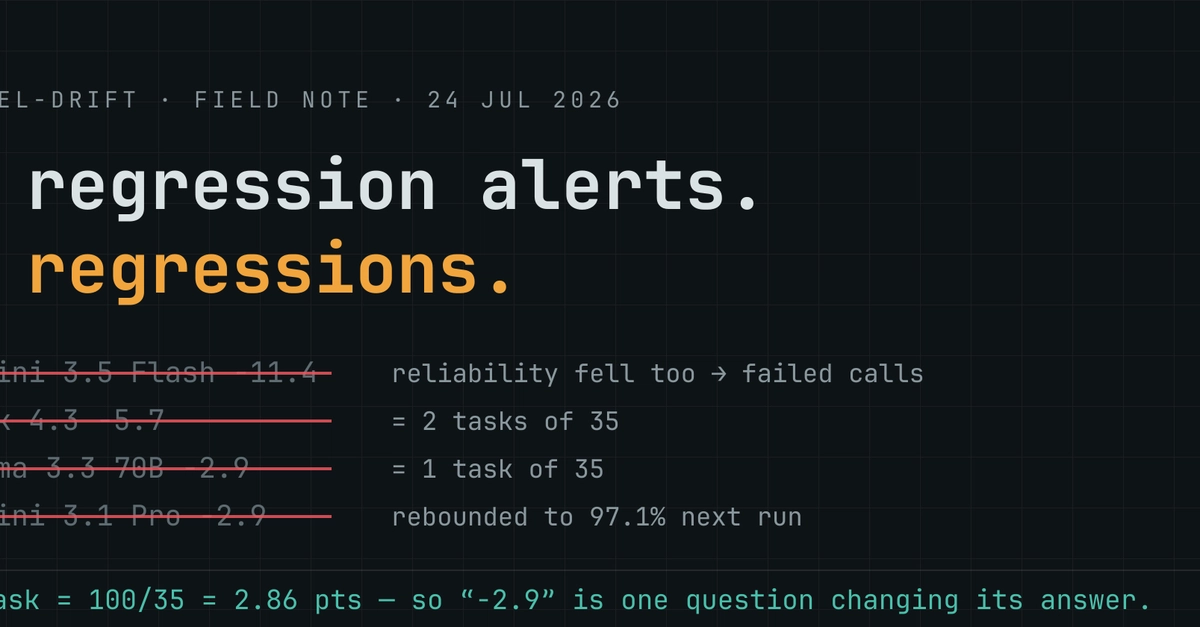
23 Jul  Gemini 3.5 Flash   -11.4 pts
24 Jul  Gemini 3.1 Pro      -2.9 pts
21 Jul  Grok 4.3            -5.7 pts
22 Jul  Llama 3.3 70B       -2.9 pts
Enter fullscreen mode Exit fullscreen mode
Four regressions in four days, across three labs. That's a post that writes itself, and it would have been fast, legible, and wrong.
None of those models got worse. Here's how I know, because the how is the only part worth reading.
Two of them weren't the model
Every point on the board carries a second number next to accuracy: reliability, the share of probe calls that actually came back. Look at the two Google alerts with that column showing:
gemini-3.5-flash  22 Jul  acc 1.000  reliability 1.000
                  23 Jul  acc 0.886  reliability 0.914   <- "-11.4 pts"

gemini-3.1-pro    22 Jul  acc 0.914  reliability 0.943
                  23 Jul  acc 0.886  reliability 0.914   <- "-2.9 pts"
                  24 Jul  acc 0.971  reliability 1.000   <- next clean run
Enter fullscreen mode Exit fullscreen mode
Accuracy and reliability fell together. That's the signature of calls that never returned, not answers that got worse — a failed call has no answer to grade, and an ungraded task scores the same as a wrong one.
I know this signature well because this board already published the lesson. On 20 July, Llama 3.3 70B appeared to fall 66 points overnight:
api.groq.com -> 429: Rate limit reached for model `llama-3.3-70b-versatile`
service tier `on_demand` ... requests per minute (RPM): Limit 30, Used 30
Enter fullscreen mode Exit fullscreen mode
34 of 35 calls were rate-limited. The model didn't get dumber; a 429 scored as a zero. A rate limit scoring as a 0% is the single most misleading thing a drift tracker can do, because it looks exactly like the thing the tracker exists to catch.
Gemini 3.1 Pro settles its own case: the next clean run came back at 97.1%, higher than before the "regression."
The other two were one question
The remaining two alerts are more interesting, because reliability held at 1.000 the whole time. Those numbers are real:
grok-4.3        0.800 -> 0.743   = -5.7 pts
llama-3.3-70b   0.800 -> 0.771   = -2.9 pts
Enter fullscreen mode Exit fullscreen mode
The suite is 35 tasks. One task is 100/35 = 2.86 points.
So -2.9 points is one question changing its answer. -5.7 is two. And -11.4, the scariest number in the set, is four.
A 35-task suite cannot resolve anything finer than about three points. Every "regression" my board flagged this week was an integer number of questions, which is the tell: I wasn't measuring drift, I was measuring the granularity of my own instrument. Reporting a one-question flip as a model regression is reading noise as signal — and doing it in public, about a named company's model.
Why the alerting is still right to be loud
The obvious fix is to make the tracker quieter — only fire above 10 points, say. I don't think that's right. A tracker that only fires on catastrophes misses the drift you actually want to catch, and the -11.4 that turned out to be failed calls is exactly the shape of a real regression. Sensitivity is the feature.
Sensitivity is only safe, though, if something downstream is willing to say no. So the alert doesn't publish anything. It writes a stub that says, in its own text:
Auto-logged when the scheduled probe flagged a run-over-run regression. Before this becomes a post, check the run log and the Reliability metric — a rate limit or provider outage can look exactly like a regression.
The automation's job is to notice. Mine is to check. This week that split did real work: four notices, zero posts.
The number I actually care about
If you build evals, you already track your models' scores. The metric I'd argue you're missing is the share of your own alerts that survive checking.
Mine, this week, was zero. That's not a comfortable number to publish, and it's the most useful one I have — it tells me the suite is too small to resolve single-task noise, and that reliability has to sit beside accuracy on every chart or the chart lies.
Both of those are fixable. Neither would have been visible if I'd shipped the post the tracker wrote for me.
The hard part of a drift tracker isn't detecting drift. It's not manufacturing it.
The board: egnaro9.github.io/model-drift — 16 models, 5 metrics, daily, every run kept. The field notes are on the page; this one is "Four regression alerts, zero regressions."
The code: github.com/egnaro9/model-drift. No LLM-as-judge anywhere — every task is graded by a fixed deterministic check, so a score change means the model moved, not the test.
0 Comments
Log in to join the conversation.No comments yet. Be the first to share your thoughts.