
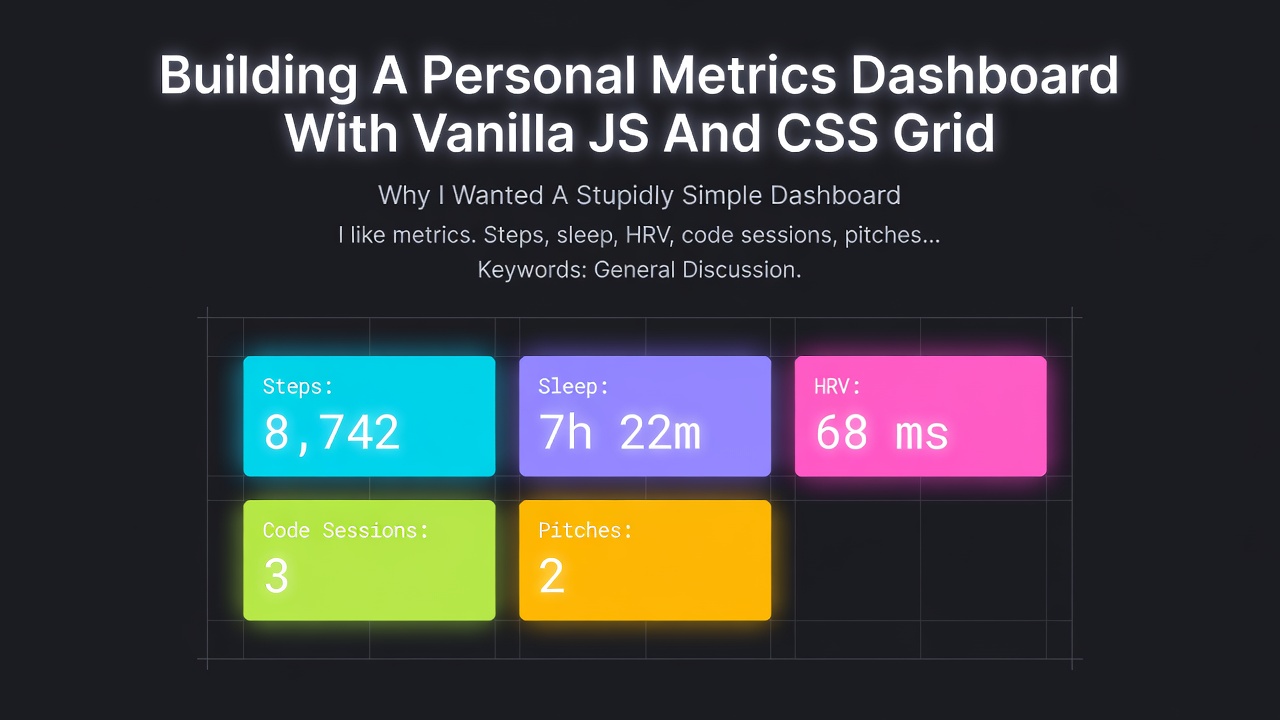
Why I Wanted A Stupidly Simple Dashboard
I like metrics. Steps, sleep, HRV, code sessions, pitches thrown at practice, deep work blocks. If I do not see them, I ignore them. If I need three apps to see them, I definitely ignore them.
I kept bouncing between Notion dashboards, random SaaS analytics, and a graveyard of half-finished React side projects. All of them felt heavy. Too many moving parts. Too much ceremony for something I want to glance at over coffee.
So I built a personal dashboard that runs on one index.html file. No framework. No build step. Just vanilla JS, CSS Grid, and localStorage. I open a browser tab and my day is there.
The Hardest Part Was Saying No To Frameworks
I write React for client work. I like it. I also think it is completely overkill for a single-user dashboard that never leaves my machine.
The temptation is real though. You start thinking, what if I want charts, routing, theming, offline sync? That is how you turn a weekend project into a year-long migration plan.
I forced myself into four constraints:
- Single
index.htmlfile, optionalstyle.css,app.js - No bundler, no transpiler, no Node install step
- ECMAScript modules only if absolutely necessary
- Everything must be readable in five years with no docs
If I could not solve something with native browser features, I removed the feature. This sounds harsh, but it kept the thing shippable.
Defining The Metrics That Actually Matter
Before touching code, I listed what I actually care about each day. Not what looks cool on a dashboard. What I am annoyed about if I do not see it.
I ended up with five panels:
- Sleep: hours slept, subjective quality
- Training: baseball sessions, pitches thrown, lifting
- Deep work: focused blocks, start and end times
- Input: reading time, long-form articles, podcasts
- Biomarkers: HRV, resting HR, morning weight
Each of these needed two things: a quick way to log a number, and a quick way to see a trend over the last 7 to 30 days. That is it. No filters. No export. Future me can build that if it actually hurts.
One HTML File, No Build Step
The structure lives in a stupidly simple index.html. No templates. No JSX. Just semantic-ish HTML and a few attributes I can hook into.
<!doctype html>
<html lang="en">
<head>
  <meta charset="utf-8" />
  <title>Daily Metrics Dashboard</title>
  <meta name="viewport" content="width=device-width, initial-scale=1" />
  <link rel="stylesheet" href="style.css" />
</head>
<body>
  <main class="dashboard">
    <section class="card" data-panel="sleep">
      <header>
        <h2>Sleep</h2>
        <div class="card-meta">
          <span data-sleep-average>0h avg</span>
        </div>
      </header>
      <div class="card-body">
        <label>
          Hours
          <input type="number" step="0.25" min="0" max="12" data-sleep-hours />
        </label>
        <label>
          Quality
          <select data-sleep-quality>
            <option value="1">Awful</option>
            <option value="2">Bad</option>
            <option value="3" selected>Ok</option>
            <option value="4">Good</option>
            <option value="5">Great</option>
          </select>
        </label>
        <button data-sleep-save>Save today</button>
        <div class="sparkline" data-sleep-sparkline></div>
      </div>
    </section>

    <!-- more cards: training, deep work, input, biomarkers -->
  </main>

  <script src="app.js" type="module"></script>
</body>
</html>
I rely on data-* attributes instead of IDs everywhere. It keeps things naturally namespaced per panel. Also it avoids global ID soup.
CSS Grid Makes Layout Boring In A Good Way
I wanted the layout to feel like a real dashboard, not a vertical stack of forms. CSS Grid is perfect for this. No framework. No utility classes. One layout definition.
/* style.css */

:root {
  --bg: #050509;
  --card-bg: #111827;
  --accent: #22c55e;
  --text: #e5e7eb;
  --muted: #6b7280;
  --border-radius: 10px;
  --gap: 1.2rem;
  --font: system-ui, -apple-system, BlinkMacSystemFont, "Segoe UI", sans-serif;
}

* {
  box-sizing: border-box;
}

body {
  margin: 0;
  min-height: 100vh;
  font-family: var(--font);
  background: radial-gradient(circle at top, #0f172a 0, #020617 55%, #000 100%);
  color: var(--text);
}

.dashboard {
  max-width: 1200px;
  margin: 2rem auto;
  padding: 0 1rem 2rem;
  display: grid;
  grid-template-columns: repeat(4, minmax(0, 1fr));
  grid-auto-rows: minmax(180px, auto);
  gap: var(--gap);
}

.card {
  background: linear-gradient(145deg, #0b1120, #020617);
  border-radius: var(--border-radius);
  padding: 1rem 1.1rem 1.2rem;
  border: 1px solid rgba(148, 163, 184, 0.15);
  box-shadow: 0 18px 40px rgba(15, 23, 42, 0.8);
  display: flex;
  flex-direction: column;
}

.card header {
  display: flex;
  align-items: baseline;
  justify-content: space-between;
  margin-bottom: 0.75rem;
}

.card h2 {
  font-size: 0.95rem;
  letter-spacing: 0.08em;
  text-transform: uppercase;
  color: var(--muted);
}

.card-meta span {
  font-size: 0.8rem;
  color: var(--muted);
}

.card-body {
  display: grid;
  grid-template-columns: repeat(2, minmax(0, 1fr));
  gap: 0.75rem 1rem;
  align-items: flex-start;
}

.card label {
  display: flex;
  flex-direction: column;
  gap: 0.3rem;
  font-size: 0.78rem;
  color: var(--muted);
}

input, select, button {
  font: inherit;
  border-radius: 6px;
  border: 1px solid rgba(148, 163, 184, 0.25);
  padding: 0.35rem 0.5rem;
  background: rgba(15, 23, 42, 0.9);
  color: var(--text);
}

button {
  cursor: pointer;
  border-color: rgba(34, 197, 94, 0.4);
  background: radial-gradient(circle at top left, #22c55e, #15803d);
  color: #ecfdf5;
  font-size: 0.8rem;
}

button:hover {
  filter: brightness(1.03);
}

.sparkline {
  grid-column: 1 / -1;
  margin-top: 0.4rem;
  height: 48px;
  display: grid;
  grid-template-columns: repeat(30, 1fr);
  align-items: end;
  gap: 2px;
}

.sparkline-bar {
  background: conic-gradient(from 160deg, #22c55e, #3b82f6);
  border-radius: 999px 999px 2px 2px;
  opacity: 0.35;
}

.sparkline-bar--today {
  opacity: 1;
}

@media (max-width: 900px) {
  .dashboard {
    grid-template-columns: repeat(2, minmax(0, 1fr));
  }
}

@media (max-width: 640px) {
  .dashboard {
    grid-template-columns: 1fr;
  }
}
The grid itself is boring. That is the point. CSS Grid lets me think about meaning instead of micro positioning. If I need a card to be wider, I can add one class and span more columns.
Tiny Data Model, Stored In localStorage
I do not want a backend for this. I just want the browser to remember my numbers. localStorage is enough if you keep the data model predictable.
The core idea: store everything indexed by an ISO date string. For example "2024-03-21". Each date holds an object with my metrics.
// app.js

const STORAGE_KEY = "rl-dashboard-v1";

function loadState() {
  try {
    const raw = localStorage.getItem(STORAGE_KEY);
    if (!raw) return {};
    return JSON.parse(raw);
  } catch (e) {
    console.warn("Failed to load state", e);
    return {};
  }
}

function saveState(state) {
  localStorage.setItem(STORAGE_KEY, JSON.stringify(state));
}

function todayKey() {
  return new Date().toISOString().slice(0, 10); // YYYY-MM-DD
}

let state = loadState();
State shape looks like this in practice:
{
  "2024-03-21": {
    sleep: { hours: 7.5, quality: 4 },
    training: { pitches: 60, gym: true },
    deepWork: { blocks: 3, minutes: 150 },
    input: { readingMinutes: 45 },
    biomarkers: { hrv: 78, weight: 81.4 }
  },
  "2024-03-22": {
    sleep: { hours: 6.25, quality: 3 }
  }
}
I did not over-normalise it. This is a personal tool, not a multi-tenant SaaS. Flat JSON is fine.
Wiring Panels With Vanilla JS
With the HTML scaffold and a single source of truth, wiring up panels becomes repetitive in a nice way. I like boring JS.
const panels = {
  sleep: {
    selector: "[data-panel='sleep']",
    getDefault() {
      return { hours: 0, quality: 3 };
    },
    readFromDOM(root) {
      return {
        hours: Number(root.querySelector("[data-sleep-hours]").value || 0),
        quality: Number(root.querySelector("[data-sleep-quality]").value || 3)
      };
    },
    writeToDOM(root, value) {
      root.querySelector("[data-sleep-hours]").value = value?.hours ?? "";
      root.querySelector("[data-sleep-quality]").value = value?.quality ?? 3;
    },
    extractSeriesForSparkline(state) {
      const last30 = getLastNDatesKeys(30);
      return last30.map((key) => state[key]?.sleep?.hours ?? 0);
    },
    updateMeta(root, state) {
      const values = Object.values(state)
        .map((entry) => entry.sleep?.hours)
        .filter((v) => typeof v === "number" && v > 0);

      const avg = values.length
        ? (values.reduce((a, b) => a + b, 0) / values.length).toFixed(1)
        : "0";

      root.querySelector("[data-sleep-average]").textContent = `${avg}h avg`;
    }
  }
  // training, deepWork etc. follow the same pattern
};

function getLastNDatesKeys(n) {
  const arr = [];
  const d = new Date();
  for (let i = n - 1; i >= 0; i--) {
    const copy = new Date(d);
    copy.setDate(d.getDate() - i);
    arr.push(copy.toISOString().slice(0, 10));
  }
  return arr;
}

function init() {
  Object.entries(panels).forEach(([key, panel]) => {
    const root = document.querySelector(panel.selector);
    if (!root) return;

    const today = todayKey();
    const todayValue = state[today]?.[key] ?? panel.getDefault();
    panel.writeToDOM(root, todayValue);

    const saveButton = root.querySelector(`[data-${key}-save]`);
    if (saveButton) {
      saveButton.addEventListener("click", () => {
        const current = panel.readFromDOM(root);
        state = {
          ...state,
          [today]: {
            ...(state[today] || {}),
            [key]: current
          }
        };
        saveState(state);
        renderSparkline(root, panel.extractSeriesForSparkline(state));
        panel.updateMeta(root, state);
      });
    }

    renderSparkline(root, panel.extractSeriesForSparkline(state));
    panel.updateMeta(root, state);
  });
}

document.addEventListener("DOMContentLoaded", init);
There are no frameworks hiding here. Just objects, DOM queries, and event listeners. The code is not clever. That is intentional.
Fake Charts With CSS Grid Sparklines
I like charts yet I did not want to pull in a charting library. Also I did not want to touch canvas or SVG for something that can be implied visually instead of exactly measured.
The small sparkline at the bottom of each card is just a CSS Grid with 30 skinny divs.
function renderSparkline(root, series) {
  const container = root.querySelector(".sparkline");
  if (!container) return;

  const max = Math.max(...series, 1);
  container.innerHTML = "";

  series.forEach((value, index) => {
    const bar = document.createElement("div");
    bar.className = "sparkline-bar";
    if (index === series.length - 1) {
      bar.classList.add("sparkline-bar--today");
    }
    const height = (value / max) * 100;
    bar.style.height = `${height}%`;
    container.appendChild(bar);
  });
}
This gives me a quick gut feel for trends. Did sleep drop off this week. Did deep work flatline around launch. I do not need axes or tooltips for that.
Keyboard-First, Mouse-Optional
I use this thing twice a day. Morning and night. If it requires mouse gymnastics, I will stop entering data within a week. So I sketched a few constraints around interaction.
- Tab order flows correctly across inputs and panels
- Enter key on a focused input should not accidentally submit anything
- Pressing Cmd+Shift+D focuses the first field of the first card
The shortcut handling is trivial.
document.addEventListener("keydown", (event) => {
  const isMac = navigator.platform.toUpperCase().indexOf("MAC") >= 0;
  const mod = isMac ? event.metaKey : event.ctrlKey;

  if (mod && event.shiftKey && event.key.toLowerCase() === "d") {
    event.preventDefault();
    const first = document.querySelector(".card input, .card select");
    if (first) first.focus();
  }
});
I do not bother with a full command palette. This one shortcut gets me into logging mode quickly and that is enough.
Syncing External Data Without An API
Some metrics live elsewhere. Sleep from Oura. Steps from Apple Health. CRM stuff in another app. I did not bother with OAuth flows or background sync yet. I cheat.
Once a week, I export CSV from the relevant app, copy the range I care about, then paste values into a textarea in a hidden admin card. The admin card parses the pasted block and merges entries into state.
The code is ugly and specific to each export format, so I am not pasting it here, but the principle is simple. Manual copy paste beats half-baked API integration that breaks whenever a vendor feels like it.
Why I Still Avoided Any Build Tools
I write a lot of production code that goes through bundlers, minifiers, linters, and whatever new hot loader is trending. For this project I wanted the opposite feeling.
Practical upside:
- I can open the file from disk in any browser and everything works
- No dependency tree, no npm audit noise, no broken lockfiles
- Page reload is the only refresh mechanism I need
Debugging is also stupidly simple. Inspect element. Edit markup. Tweak CSS in the browser. Drag changes back into my editor. Old school, but it works.
Things I Intentionally Did Not Add
I get tempted by new features fast. So I kept a short list of things I would actively not build in version one.
- No user accounts, obviously. Only I use this.
- No theming system. Hardcoded dark theme, take it or leave it.
- No date picker. You can only edit today. Past corrections go through a JSON edit.
- No notifications. I already have enough apps yelling at me.
This kind of intentional laziness matters. I would rather have a boring dashboard that I open daily than a sophisticated data product that I abandon.
What This Setup Is Good For
I would not build a client-facing product like this. But for personal tools, I think we underestimate what we can do with plain HTML, CSS Grid, and vanilla JS.
This approach works well when:
- You are the only user
- You do not need real-time collaboration or multi-device sync
- You value reliability over features
- You want to be able to fix it in five minutes, even half-asleep
My dashboard loads instantly, never breaks on library updates, and is easy to tweak. Yesterday I added a tiny "coach" card that tracks how many kids I threw live BP to that week. It took ten minutes and zero npm commands.
That is the upside of staying close to the metal. You trade fancy abstractions for control. For a personal metrics dashboard, I will take that deal every time.
0 Comments
Log in to join the conversation.No comments yet. Be the first to share your thoughts.