
The package garchf wraps
the extensive GARCH modeling machinery in
rugarch
behind a
forecast-style
interface, so that GARCH-based forecasts can be produced, plotted, and
evaluated with the same conventions used throughout the forecast
ecosystem (in the spirit of functions like forecast::thetaf()). The
workhorse function, xgarchf(), fits a GARCH model to a univariate time
series – with a choice of variance model (sGARCH, eGARCH,
gjrGARCH, apARCH, iGARCH, …), ARMA order for the conditional mean,
GARCH order, and conditional distribution – and returns a standard
forecast object containing point forecasts, prediction intervals, and
simulated paths. Because the output integrates with forecast’s S3
methods, plot() and other generics work out of the box, and the
simulated paths (sims) make it straightforward to compute richer
probabilistic forecasting metrics (CRPS, pinball loss, Winkler scores,
etc.) via cross-validation. Below, we illustrate xgarchf() on Google’s
daily closing stock price returns, and then run a small cross-validation
exercise comparing a few GARCH variants using the
crossvalidation
package.
library(garchf)

Registered S3 method overwritten by 'quantmod':
  method            from
  as.zoo.data.frame zoo
1 – Graphs
y <- diff(log(fpp2::goog200))

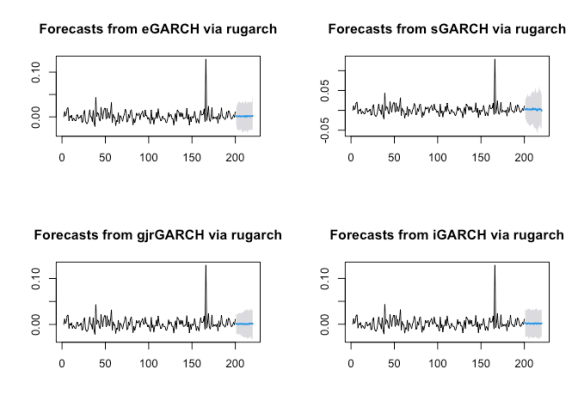
fit1 <- xgarchf(y, h = 20, model = "eGARCH")
fit2 <- xgarchf(y, h = 20, model = "sGARCH")
fit3 <- xgarchf(y, h = 20, model = "gjrGARCH")
fit4 <- xgarchf(y, h = 20, model = "iGARCH")

print(summary(fitted(fit1)))

    Min.  1st Qu.   Median     Mean  3rd Qu.     Max.
0.001504 0.001504 0.001504 0.001504 0.001504 0.001504
    Min.  1st Qu.   Median     Mean  3rd Qu.     Max.
0.002783 0.002783 0.002783 0.002783 0.002783 0.002783
    Min.  1st Qu.   Median     Mean  3rd Qu.     Max.
0.001233 0.001233 0.001233 0.001233 0.001233 0.001233
    Min.  1st Qu.   Median     Mean  3rd Qu.     Max.
0.001485 0.001485 0.001485 0.001485 0.001485 0.001485
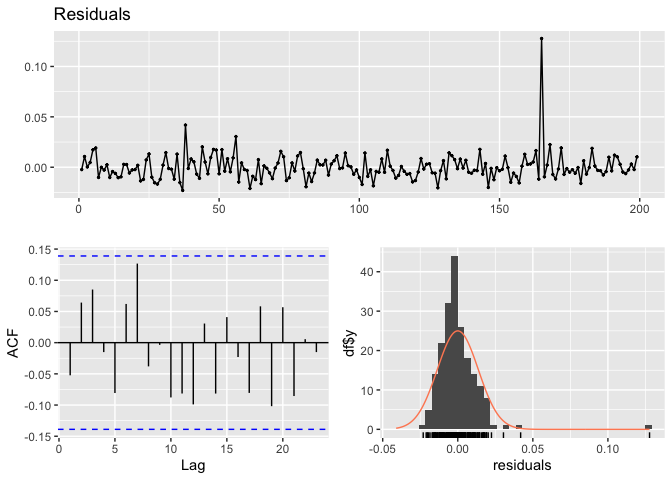
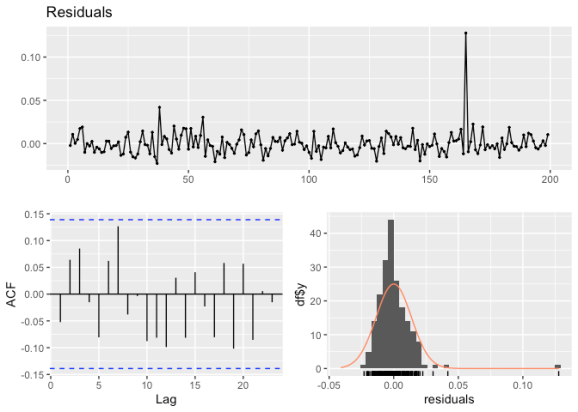
    Ljung-Box test

data:  Residuals
Q* = 10.341, df = 10, p-value = 0.4111

Model df: 0.   Total lags used: 10
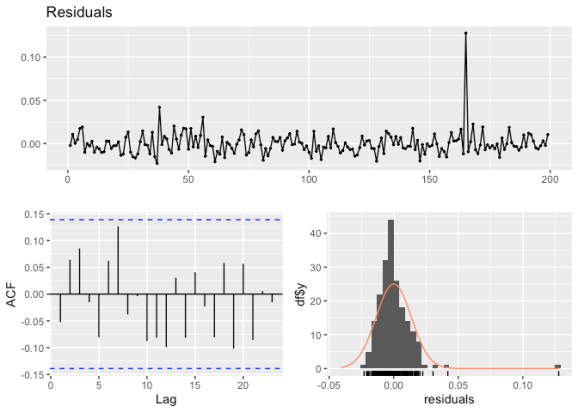
    Ljung-Box test

data:  Residuals
Q* = 10.341, df = 10, p-value = 0.4111

Model df: 0.   Total lags used: 10
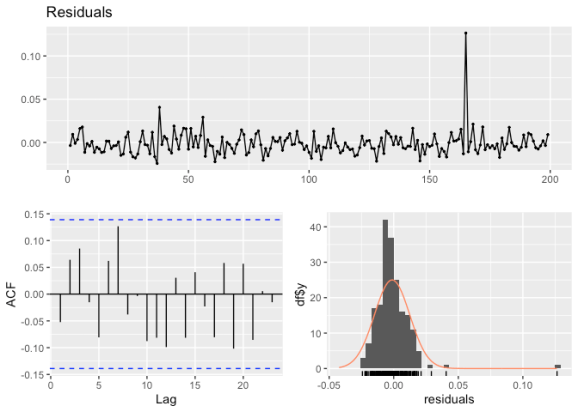
    Ljung-Box test

data:  Residuals
Q* = 10.341, df = 10, p-value = 0.4111

Model df: 0.   Total lags used: 10
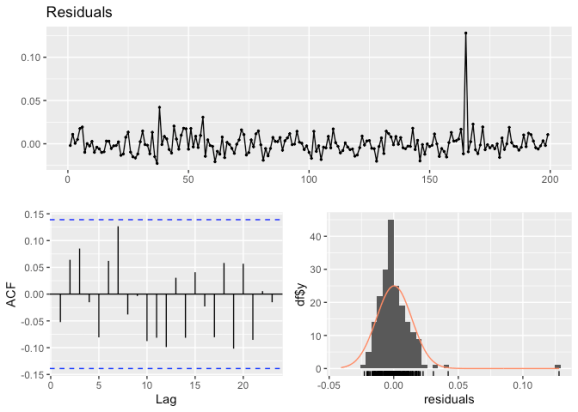
    Ljung-Box test

data:  Residuals
Q* = 10.341, df = 10, p-value = 0.4111

Model df: 0.   Total lags used: 10
2 - Cross-validation with the package crossvalidation
For crossvalidation, see
https://github.com/Techtonique/crossvalidation.
spl_m5 <- function(predicted,
                   observed,
                   probs = c(0.005, 0.025, 0.165, 0.25,
                             0.5,
                             0.75, 0.835, 0.975, 0.995))
{
  if (is.null(predicted$sims)) {
    stop("predicted$sims is required")
  }

  # training series from forecast object
  train <- as.numeric(predicted$x)

  # M5 scaling denominator
  scale_denom <- mean(abs(diff(train)), na.rm = TRUE)

  if (scale_denom <= 0 || !is.finite(scale_denom)) {
    scale_denom <- 1
  }

  sims <- predicted$sims

  # quantile forecasts: rows = horizons, cols = probs
  qhat <- sapply(
    probs,
    function(p) apply(sims, 1, stats::quantile, probs = p, na.rm = TRUE)
  )

  observed <- as.numeric(observed)

  # pinball loss
  pinball_vec <- numeric(length(probs))

  for (j in seq_along(probs)) {

    u <- probs[j]
    q <- qhat[, j]

    pinball_vec[j] <- mean(
      ifelse(
        observed >= q,
        u * (observed - q),
        (1 - u) * (q - observed)
      ),
      na.rm = TRUE
    )
  }

  # scaled pinball loss for each quantile
  spl_vec <- pinball_vec / scale_denom

  # average scaled pinball loss
  mean_spl <- mean(spl_vec)

  out <- c(
    mean_SPL = mean_spl
  )

  names(spl_vec) <- paste0("SPL_", probs)

  c(out, spl_vec)
}

eval_metric95 <- function(predicted, observed)
{
  error <- observed - predicted$mean

  rmse <- sqrt(mean(error^2))
  mae <- mean(abs(error))

  # Only one interval returned
  lower <- predicted$lower
  upper <- predicted$upper

  coverage <- mean(
    observed >= lower & observed <= upper
  )

  alpha <- 0.05

  winkler <- ifelse(
    observed < lower,
    (upper - lower) + (2 / alpha) * (lower - observed),
    ifelse(
      observed > upper,
      (upper - lower) + (2 / alpha) * (observed - upper),
      (upper - lower)
    )
  )

  spl <- spl_m5(predicted, observed)

  c(
    RMSE = rmse,
    MAE = mae,
    Coverage95 = coverage,
    Winkler95 = mean(winkler),
    CRPS = mean(scoringRules::crps_sample(observed, predicted$sims)),
    mean_SPL = as.numeric(spl["mean_SPL"])
  )
}

eval_metric80 <- function(predicted, observed)
{
  error <- observed - predicted$mean

  me <- mean(error)
  rmse <- sqrt(mean(error^2))
  mae <- mean(abs(error))

  # Only one interval returned
  lower <- predicted$lower
  upper <- predicted$upper

  coverage <- mean(
    observed >= lower & observed <= upper
  )

  alpha <- 0.2

  winkler <- ifelse(
    observed < lower,
    (upper - lower) + (2 / alpha) * (lower - observed),
    ifelse(
      observed > upper,
      (upper - lower) + (2 / alpha) * (observed - upper),
      (upper - lower)
    )
  )

  spl <- spl_m5(predicted, observed)

  c(
    ME = me,
    RMSE = rmse,
    MAE = mae,
    Coverage80 = coverage,
    Winkler80 = mean(winkler),
    CRPS = mean(scoringRules::crps_sample(observed, predicted$sims)),
    mean_SPL = as.numeric(spl["mean_SPL"])
  )
}

res <- crossvalidation::crossval_ts(
  y = y,
  initial_window = 150,
  horizon = 10,
  fixed_window = FALSE,
  fcast_func = garchf::xgarchf,
  eval_metric = eval_metric95,
  fit_params = list(arma_order=c(0, 0),
                    garch_order = c(1, 1),
                    model = "eGARCH",
                    level=95),
  show_progress = FALSE
)
print(summary(res))

res <- crossvalidation::crossval_ts(
  y = y,
  initial_window = 150,
  horizon = 10,
  fixed_window = FALSE,
  fcast_func = garchf::xgarchf,
  eval_metric = eval_metric95,
  fit_params = list(arma_order=c(0, 0),
                    garch_order = c(1, 1),
                    model = "sGARCH",
                    level=95),
  show_progress = FALSE
)
print(summary(res))

res <- crossvalidation::crossval_ts(
  y = y,
  initial_window = 150,
  horizon = 10,
  fixed_window = FALSE,
  fcast_func = garchf::xgarchf,
  eval_metric = eval_metric95,
  fit_params = list(arma_order=c(0, 0),
                    garch_order = c(1, 1),
                    model = "iGARCH",
                    level=95),
  show_progress = FALSE
)
print(summary(res))

      RMSE               MAE             Coverage95       Winkler95
 Min.   :0.006459   Min.   :0.004896   Min.   :0.7000   Min.   :0.03441
 1st Qu.:0.008001   1st Qu.:0.006266   1st Qu.:0.9000   1st Qu.:0.06153
 Median :0.009135   Median :0.007061   Median :1.0000   Median :0.06466
 Mean   :0.017189   Mean   :0.010613   Mean   :0.9475   Mean   :0.20090
 3rd Qu.:0.022415   3rd Qu.:0.015066   3rd Qu.:1.0000   3rd Qu.:0.47706
 Max.   :0.042741   Max.   :0.023054   Max.   :1.0000   Max.   :0.96625
      CRPS             mean_SPL
 Min.   :0.004154   Min.   :0.1170
 1st Qu.:0.004922   1st Qu.:0.1362
 Median :0.005311   Median :0.1481
 Mean   :0.010039   Mean   :0.3380
 3rd Qu.:0.017800   3rd Qu.:0.6763
 Max.   :0.051416   Max.   :1.6607

      RMSE               MAE             Coverage95       Winkler95
 Min.   :0.006554   Min.   :0.005380   Min.   :0.7000   Min.   :0.03856
 1st Qu.:0.008424   1st Qu.:0.006561   1st Qu.:0.9750   1st Qu.:0.06261
 Median :0.009314   Median :0.007401   Median :1.0000   Median :0.07277
 Mean   :0.017155   Mean   :0.010741   Mean   :0.9525   Mean   :0.17716
 3rd Qu.:0.020081   3rd Qu.:0.013012   3rd Qu.:1.0000   3rd Qu.:0.34988
 Max.   :0.042568   Max.   :0.022999   Max.   :1.0000   Max.   :0.49756
      CRPS             mean_SPL
 Min.   :0.004634   Min.   :0.1349
 1st Qu.:0.005383   1st Qu.:0.1516
 Median :0.005695   Median :0.1606
 Mean   :0.008842   Mean   :0.2986
 3rd Qu.:0.012903   3rd Qu.:0.4725
 Max.   :0.019442   Max.   :0.7436

    RMSE               MAE             Coverage95       Winkler95
 Min.   :0.006556   Min.   :0.005514   Min.   :0.7000   Min.   :0.03580
 1st Qu.:0.008306   1st Qu.:0.006239   1st Qu.:0.9750   1st Qu.:0.06307
 Median :0.009119   Median :0.007007   Median :1.0000   Median :0.06478
 Mean   :0.017029   Mean   :0.010484   Mean   :0.9525   Mean   :0.16725
 3rd Qu.:0.018881   3rd Qu.:0.011711   3rd Qu.:1.0000   3rd Qu.:0.16760
 Max.   :0.042713   Max.   :0.023064   Max.   :1.0000   Max.   :0.51546
      CRPS             mean_SPL
 Min.   :0.004851   Min.   :0.1363
 1st Qu.:0.005317   1st Qu.:0.1510
 Median :0.005700   Median :0.1591
 Mean   :0.008720   Mean   :0.2928
 3rd Qu.:0.009316   3rd Qu.:0.3126
 Max.   :0.019649   Max.   :0.7586
0 Comments
Log in to join the conversation.No comments yet. Be the first to share your thoughts.