
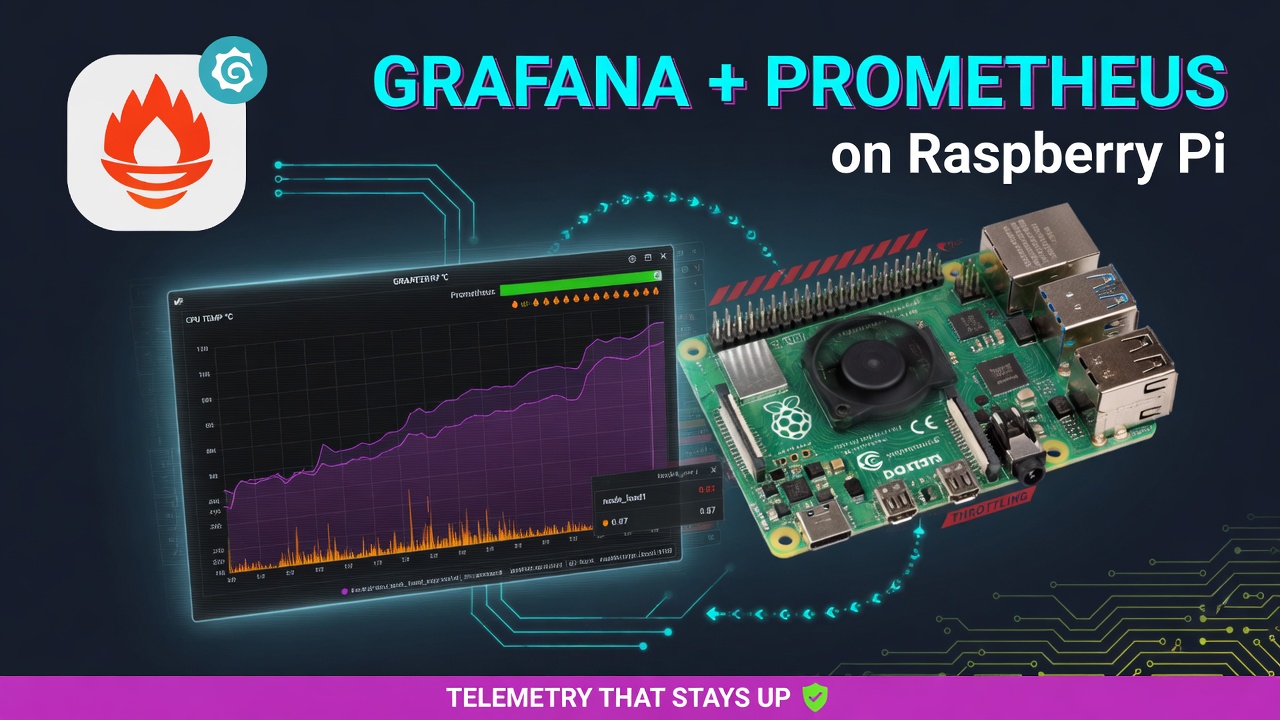
TL;DR: The failure mode nobody warns you about with Raspberry Pi clusters: the service dies, you SSH in twenty minutes later, and
dmesgshows the CPU was thermally throttling for two hours before the crash. No alert fired.
📖 Reading time: ~21 min
What's in this article
- The Problem: Flying Blind on Low-Power Hardware
- Architecture Before You Install Anything
- Installation: Docker Compose Stack with Real Config Files
- node_exporter: What to Enable and What to Skip
- Building the Dashboard: Panels That Catch Real Problems
- Alerting Without AlertManager Complexity
- Gotchas That Will Cost You an Afternoon
The Problem: Flying Blind on Low-Power Hardware
The failure mode nobody warns you about with Raspberry Pi clusters: the service dies, you SSH in twenty minutes later, and dmesg shows the CPU was thermally throttling for two hours before the crash. No alert fired. Nothing logged the temperature climb. You were flying completely blind while your node was quietly strangling itself.
Thermal throttling on ARM chips is insidious because it doesn't fail loudly — it just makes everything slower in a way that looks like bad code. The Pi 4 and Pi 5 will both throttle aggressively when the SoC hits 80°C, dropping clock speed without any visible error. SD card I/O saturation is the same story: iowait climbs past 40%, your service's write queue backs up, and the symptom looks like a memory leak or a hung process. Memory exhaustion on a 2GB board will OOM-kill a process while leaving the system technically "up," which means your monitoring check passes but your actual workload is dead. Without instrumentation, you're diagnosing all of this from crash artifacts instead of catching the curve before it peaks.
The minimal signal set you actually need to answer these questions is smaller than most guides suggest. Four metrics cover the majority of failure modes on constrained hardware:
- CPU temperature — the raw SoC temp in Celsius, not CPU utilization, which can look fine while the chip throttles
- Memory pressure — available memory plus swap usage, because free memory is misleading when the kernel is aggressively reclaiming cache
- Disk I/O wait —
iowaitpercentage and queue depth, which catches SD card saturation before it becomes a hang - Network throughput — bytes in/out per interface, which surfaces runaway log shippers or unexpected traffic on headless nodes
Prometheus plus Grafana wins on this hardware class for a specific structural reason: the scrape model puts the collection burden on the exporter, not a persistent agent. node_exporter on ARM64 idles around 10–20MB RSS during normal operation — it wakes up, serves a scrape, and goes back to sleep. Compare that to the Telegraf + InfluxDB stack, where Telegraf runs continuous collection intervals and InfluxDB's write-ahead log and compaction processes compete for memory on the same 1–4GB budget. The Prometheus TSDB is also local-queryable without a separate query engine, which matters when you're running Grafana on the same Pi rather than a separate host. The tradeoff you accept is that Prometheus's local retention gets expensive on disk past 15 days of high-cardinality data — on an SD card, that's a real constraint you'll need to tune. If you're also running AI tooling or heavier inference workloads on the same Pi or a companion machine, the AI Coding Tools in 2026: Cloud Copilots vs Local Models guide covers the broader toolchain context worth reading before you allocate RAM budgets across competing services.
One gotcha that isn't in the official docs: Prometheus's default scrape interval of 15 seconds is too coarse to catch transient I/O spikes on slow SD cards. A spike that saturates the card for 8 seconds and then clears will be missed entirely between two 15-second samples. Drop the scrape interval to 5 seconds for disk metrics specifically — you can do this per-job in the scrape config without affecting everything else — and your storage costs increase proportionally, so plan retention accordingly before you commit.
Architecture Before You Install Anything
The topology decision matters more than any config tweak you'll make later. Running Prometheus and Grafana directly on the Pi 4 is the obvious path, but on a 4 GB model you're looking at Prometheus sitting around 80–150 MB RSS at rest, Grafana adding another 100–150 MB, plus whatever else the OS is doing. That's 300–400 MB committed before you've scraped a single metric. It's workable, but if the Pi is already doing something else — running a media server, a home automation stack, anything that actually uses memory — you'll feel it. The cleaner split is running Prometheus and Grafana on a separate host (a spare x86 machine, another Pi, even a cheap VPS) and dropping only node_exporter on the Pi itself. node_exporter idles under 10 MB RSS and barely touches the CPU. That's the architecture I'd recommend if you have the option — the Pi becomes a pure data source, and your monitoring stack doesn't compete with whatever workload the Pi is actually supposed to run.
Scrape interval is where people make a quiet mistake with SD cards. The Prometheus default of 15s is sane for most metrics, but if you want to catch thermal throttling events — the Pi starts throttling at 80°C and the kernel can flip the throttle flag and clear it within seconds — you need 5s or you'll miss the event entirely in the time series. The cost of dropping to 5s isn't compute, it's writes. At 15s scrape with node_exporter exposing roughly 700–900 metrics, Prometheus writes compressed blocks to disk in chunks, not per-scrape, so the write amplification is lower than you'd expect. But at 5s you're tripling the in-memory accumulation rate and flushing chunks more frequently. On a USB SSD this is a non-issue — the write endurance is effectively unlimited at this workload. On an SD card running ext4 with default mount options, sustained small writes shorten card life measurably over months. If you're stuck with SD, at minimum mount noatime and point Prometheus's TSDB data directory at a USB stick or external drive.
The retention math is worth doing before you provision storage. Prometheus with node_exporter at a 15s scrape interval generates somewhere in the 200–400 MB range per month of compressed TSDB data — the variance comes from how many network interfaces, disks, and CPUs you're exposing. The default retention is 15 days, which keeps you under 200 MB in most node_exporter-only setups. If you add custom metrics or drop the scrape interval, recalculate. Set --storage.tsdb.retention.time explicitly regardless — if you don't set it, you're relying on the compiled default surviving across version upgrades, which it won't always do cleanly. A reasonable explicit flag for a Pi with a USB SSD:
--storage.tsdb.path=/data/prometheus \
--storage.tsdb.retention.time=30d \
--storage.tsdb.retention.size=2GB
Enter fullscreen mode Exit fullscreen mode
The retention.size flag is your safety net. Prometheus will evict oldest blocks before it hits that limit, so even if your scrape rate spikes, you won't fill the drive silently.
Docker Compose versus bare-metal is an honest trade-off, not a clear winner. Compose gives you version-pinned images, a single docker-compose.yml that you can commit to git, and teardown/rebuild in under two minutes — that reproducibility pays off the first time you corrupt a config and need to roll back. The cost is real: the Docker daemon itself plus the overhead of two containers adds roughly 80–120 MB RSS that you don't pay on bare metal. On a 4 GB Pi running nothing else, that's tolerable. On a 2 GB Pi or a Pi that's doing actual work, that overhead pushes you toward bare-metal installs via the official APT repos or prebuilt ARM binaries from the Prometheus GitHub releases page. If you go bare-metal, pin your versions explicitly in whatever provisioning script you use — prometheus-2.51.2.linux-armv7 not "latest" — because the ARM binary naming conventions have shifted between releases and an unattended upgrade can silently pull a mismatched build.
Installation: Docker Compose Stack with Real Config Files
Pinning image versions on ARM64 is non-negotiable. The latest tag for several Prometheus ecosystem images has a documented lag on ARM64 — the amd64 manifest updates first, and if your Pi pulls during that window, you either get a stale layer or a failed pull. Beyond that, unpinned images mean a docker compose pull three months from now silently changes behavior. Pick a version, write it down, upgrade deliberately.
Here's the full docker-compose.yml. Every image is pinned to a specific minor version, volumes are named (not anonymous), and the network is explicit so Prometheus can reach node-exporter by service name:
version: "3.8"

networks:
  telemetry:
    driver: bridge

volumes:
  prometheus_data:
  grafana_data:

services:
  node-exporter:
    image: prom/node-exporter:v1.8.0
    container_name: node_exporter
    restart: unless-stopped
    networks:
      - telemetry
    pid: host                          # needed to expose real host-level CPU/mem metrics
    volumes:
      - /proc:/host/proc:ro
      - /sys:/host/sys:ro
      - /:/rootfs:ro
    command:
      - '--path.procfs=/host/proc'
      - '--path.sysfs=/host/sys'
      - '--path.rootfs=/rootfs'
      - '--collector.filesystem.mount-points-exclude=^/(sys|proc|dev|host|etc)($$|/)'

  prometheus:
    image: prom/prometheus:v2.51.2
    container_name: prometheus
    restart: unless-stopped
    networks:
      - telemetry
    volumes:
      - ./prometheus.yml:/etc/prometheus/prometheus.yml:ro
      - prometheus_data:/prometheus
    command:
      - '--config.file=/etc/prometheus/prometheus.yml'
      - '--storage.tsdb.path=/prometheus'
      - '--storage.tsdb.retention.time=15d'  # explicit retention, default is 15d but state it
    user: "65534:65534"                # nobody:nogroup — see ownership note below
    ports:
      - "9090:9090"

  grafana:
    image: grafana/grafana:10.4.2
    container_name: grafana
    restart: unless-stopped
    networks:
      - telemetry
    volumes:
      - grafana_data:/var/lib/grafana
      - ./provisioning:/etc/grafana/provisioning:ro
    environment:
      - GF_SECURITY_ADMIN_PASSWORD=changeme
      - GF_USERS_ALLOW_SIGN_UP=false
    ports:
      - "3000:3000"
Enter fullscreen mode Exit fullscreen mode
The prometheus.yml scrape config below uses a job_label on the target so that if you later add a second Pi, you're not staring at unlabeled localhost:9100 entries in every query. Label the host now, even if it's a single node:
global:
  scrape_interval: 15s
  evaluation_interval: 15s

scrape_configs:
  - job_name: "node"
    static_configs:
      - targets: ["node-exporter:9100"]   # service name resolves on the telemetry network
        labels:
          host: "pi-living-room"          # change per node; shows up in every metric series
Enter fullscreen mode Exit fullscreen mode
Grafana provisioning is the piece most tutorials skip, and it's what keeps your Prometheus datasource alive through docker compose down && docker compose up. Without it, the datasource lives only in the SQLite database inside the named volume — which is fine until you recreate the volume or restore from backup without also restoring the DB. Create ./provisioning/datasources/prometheus.yaml:
apiVersion: 1

datasources:
  - name: Prometheus
    type: prometheus
    access: proxy
    url: http://prometheus:9090   # container-to-container on the shared network
    isDefault: true
    editable: false               # prevent accidental UI edits from diverging from file
    jsonData:
      timeInterval: "15s"        # match global scrape_interval or Grafana will warn
Enter fullscreen mode Exit fullscreen mode
Two ownership problems will bite you on first start if you use bind mounts instead of named volumes — and even with named volumes on some Raspberry Pi OS setups. Prometheus runs as UID 65534 (nobody) and will refuse to start if it can't write to /prometheus. If you ever switch to a bind mount for the data directory, run sudo chown -R 65534:65534 ./prometheus_data before docker compose up. Grafana uses UID 472, which is non-obvious and not the same as any default user on Raspberry Pi OS. Same fix: sudo chown -R 472:472 ./grafana_data if you're bind-mounting. Named volumes sidestep this because Docker manages the directory and applies container ownership automatically — but the moment you ls -la /var/lib/docker/volumes/ and try to manually drop files in, you're back to the same problem.
node_exporter: What to Enable and What to Skip
The default node_exporter install ships with roughly 50 collectors active. On a Pi, maybe a dozen of those are useful. The rest are either irrelevant (NFS, RAID), cause unnecessary disk writes on SD cards, or pull kernel subsystems that don't exist on ARM. Getting the collector list right upfront saves you from scraping noise and from quietly shortening the life of your boot media.
The collectors that actually earn their keep on a Pi: cpu, meminfo, diskstats, filesystem, netdev, and thermal_zone. The thermal collector reads directly from /sys/class/thermal/thermal_zone*/temp — verify it's wired up before you trust your Grafana panel by hitting the metrics endpoint directly:
curl -s localhost:9100/metrics | grep node_thermal

# expect something like:
# node_thermal_zone_temp{type="cpu-thermal",zone="0"} 52000
# value is in millidegrees — divide by 1000 for Celsius in your PromQL
Enter fullscreen mode Exit fullscreen mode
If that line is missing entirely, thermal_zone is either disabled or /sys/class/thermal is empty — check ls /sys/class/thermal/ on the host. On Pi 4 and 5 with a stock Raspberry Pi OS kernel, it's populated. If you're running a custom kernel or a container OS, it may not be.
Collectors worth explicitly disabling:
-
--no-collector.mdadm: Probes RAID arrays. There are none. It still runs and spits errors into the log on every scrape. -
--no-collector.nfsand--no-collector.nfsd: Same pattern — reads from/proc/net/rpc/nfswhich either doesn't exist or returns zeros, but the read happens on every scrape interval and counts as an I/O op on your SD card. -
--no-collector.xfsand--no-collector.zfs: Unless you're running ZFS on your Pi (you're not), drop them.
The textfile collector is underused and worth knowing. Instead of enabling a heavyweight collector that runs on every Prometheus scrape, write a cron job that dumps a .prom file on a slower schedule — say, every 5 minutes — and let textfile serve it statically. This is how I expose custom metrics like UPS battery level and Docker container counts without polling on every 15-second scrape. The setup is two lines: point node_exporter at the directory with --collector.textfile.directory=/var/lib/node_exporter/textfile, then write a script that outputs valid OpenMetrics format and drops the result atomically:
#!/bin/bash
# write to tmp then mv — prevents Prometheus scraping a partial file
TMPFILE=$(mktemp)
echo "# HELP my_sensor_temp_celsius Temperature from I2C sensor" > "$TMPFILE"
echo "# TYPE my_sensor_temp_celsius gauge" >> "$TMPFILE"
echo "my_sensor_temp_celsius $(read_sensor.py)" >> "$TMPFILE"
mv "$TMPFILE" /var/lib/node_exporter/textfile/sensors.prom
Enter fullscreen mode Exit fullscreen mode
The hwmon collector is worth a separate callout because the behavior differs by Pi model. On Pi 5, node_hwmon_temp_celsius appears in metrics, but the chip and sensor labels are sometimes empty strings, which means your Grafana query returns a result but the legend is blank and filtering by label breaks. Debug it before building any panel:
curl -s localhost:9100/metrics | grep hwmon

# Pi 5 — you might see:
# node_hwmon_temp_celsius{chip="platform_rp1_adc",sensor="temp1"} 42.651
# or chip="" sensor="" depending on kernel driver binding
Enter fullscreen mode Exit fullscreen mode
If the labels are empty, use thermal_zone metrics instead — they're more reliable across Pi generations and the type label (cpu-thermal) is always populated.
Run node_exporter directly on the host, not in a container. This is the one place where "just containerize everything" actively hurts you. The filesystem collector needs to see real mount points, not the container's namespaced view. The netdev collector needs the host network namespace to report eth0 and wlan0 accurately. If you insist on containerizing it, you need --path.rootfs=/host, a bind mount of / into the container, host network mode, and PID namespace sharing — at which point you've added four failure surfaces to get the same data you'd get from a single binary on the host. On my own setup I run node_exporter as a systemd service on the Pi itself and only Prometheus and Grafana live in Docker. The service file is minimal:
[Unit]
Description=node_exporter
After=network.target

[Service]
User=node_exporter
ExecStart=/usr/local/bin/node_exporter \
  --no-collector.mdadm \
  --no-collector.nfs \
  --no-collector.nfsd \
  --no-collector.xfs \
  --no-collector.zfs \
  --collector.textfile.directory=/var/lib/node_exporter/textfile
Restart=on-failure

[Install]
WantedBy=multi-user.target
Enter fullscreen mode Exit fullscreen mode
Drop that in /etc/systemd/system/node_exporter.service, run systemctl daemon-reload && systemctl enable --now node_exporter, and you get accurate host metrics with no namespace gymnastics.
Building the Dashboard: Panels That Catch Real Problems
The throttle ratio panel is the single most useful thing you can build for a Pi dashboard, and almost nobody sets it up. The metric node_cpu_scaling_frequency_hertz tells you the current CPU frequency; node_cpu_scaling_frequency_max_hertz tells you what it could be running at. The ratio between them is what actually matters:
node_cpu_scaling_frequency_hertz{cpu="cpu0"}
  /
node_cpu_scaling_frequency_max_hertz{cpu="cpu0"}
Enter fullscreen mode Exit fullscreen mode
A healthy Pi sits at 1.0. When it drops to 0.6 or below under load, that's not a busy system — that's a thermally limited one. The distinction matters enormously for diagnosis: if you're seeing slow response times and the CPU panel shows 80% utilization, you'll assume the workload is the problem. But if the throttle ratio is simultaneously showing 0.5, the actual problem is heat, and adding more RAM or tuning your app won't fix it. Add a stat panel with thresholds: green above 0.9, orange between 0.7–0.9, red below 0.7. Pair it with a case without airflow and you'll see red within minutes of a heavy encode or compile job.
For memory, skip node_memory_MemFree_bytes entirely. Free memory on Linux is a misleading number because the kernel aggressively uses spare RAM for disk cache. The metric that actually tells you the system is approaching an OOM kill is node_memory_MemAvailable_bytes — that's the estimate of how much memory can be reclaimed quickly. Express it as a percentage of total RAM and set a Grafana alert threshold at 15%:
100 * node_memory_MemAvailable_bytes
      / node_memory_MemTotal_bytes
Enter fullscreen mode Exit fullscreen mode
On a Pi 4 with 4GB running Prometheus, node_exporter, and a couple of containers, available memory can drift below 20% during scrape cycles without anything obviously wrong. That 15% threshold gives you a warning before the kernel starts killing processes. Wire this to a Grafana alert that fires to a webhook or ntfy.sh notification — you want to know about it before you SSH in to find your database process missing.
The disk I/O wait panel is what separates "my Pi is slow" from "my SD card is dying." Use rate(node_disk_io_time_seconds_total[2m]) on your root device — typically mmcblk0. This metric is the fraction of time the device is busy, so values above 0.8 sustained over several minutes mean processes are sitting in uninterruptible sleep waiting for the card. If you're running Prometheus's TSDB on the same SD card as the OS, you will see this spike every 2 hours when Prometheus compacts blocks to disk. That's expected. What's not expected is a sustained baseline above 0.4 with light workloads — that usually means the card is worn and write latency has degraded badly. Swap to a USB-attached SSD and watch the metric drop to near zero at idle.
Once you have panels worth keeping, export the dashboard JSON from Grafana's UI (Dashboard → Share → Export → Save to file) and commit it to your provisioning folder. The directory structure Grafana expects is /etc/grafana/provisioning/dashboards/, and you need exactly two files: a provider YAML and the dashboard JSON itself. The provider YAML is minimal:
# /etc/grafana/provisioning/dashboards/pi.yaml
apiVersion: 1
providers:
  - name: pi-dashboards
    type: file
    options:
      path: /etc/grafana/provisioning/dashboards
Enter fullscreen mode Exit fullscreen mode
Drop the exported JSON in the same directory and restart Grafana. On next boot — or after a container recreate — the dashboard is there automatically, with no clicking through the UI. The one gotcha: Grafana will treat provisioned dashboards as read-only in the UI by default. If you need to make edits, either set allowUiUpdates: true in the provider YAML (and remember to re-export after changes), or edit the JSON directly and restart. Either way, keeping the JSON in version control means your entire dashboard survives a full wipe and reinstall in about 30 seconds.
Alerting Without AlertManager Complexity
The standard Prometheus alerting story involves deploying AlertManager as a separate container, writing a routing tree in YAML, configuring inhibition rules, and maintaining receiver configs that drift out of sync with your actual intent. For a single-operator Pi setup, that's architectural overhead that buys you nothing. Grafana's unified alerting — available since Grafana 9, and now the default in Grafana 10+ — handles the entire pipeline inside the same process you're already running. One fewer container, one fewer config file to version, one fewer thing to restart when you change a threshold.
Contact points are where most people reach for email and immediately hit deliverability problems. A better pairing for self-hosted setups: either a self-hosted ntfy.sh instance or a Telegram bot webhook. Both are free, both survive the kind of flaky home network conditions where your SMTP relay might queue for ten minutes before admitting failure. The ntfy contact point in Grafana takes a URL and an optional token — that's it. For Telegram, you need a bot token from BotFather and your chat ID, then configure a webhook contact point with:
# Grafana contact point — Telegram webhook
URL: https://api.telegram.org/bot<YOUR_BOT_TOKEN>/sendMessage
HTTP Method: POST
Content-Type: application/json

# Message body (set in "Optional Webhook Settings")
{
  "chat_id": "<YOUR_CHAT_ID>",
  "text": "{{ len .Alerts.Firing }} alert(s) firing on Pi: {{ range .Alerts.Firing }}{{ .Labels.alertname }} {{ end }}"
}
Enter fullscreen mode Exit fullscreen mode
Two alert rules justify the entire setup and should be configured before you consider anything else. First: CPU temperature above 80°C sustained for 2 minutes. The 2-minute window matters — without it, a brief spike during a compile job pages you at 2am for nothing. The PromQL is straightforward if you're scraping the thermal zone via the node exporter's textfile collector or a custom metric:
# Alert: Pi CPU overtemperature
# Condition: for 2m
node_thermal_zone_temp{type="cpu-thermal"} > 80

# If you're exposing temperature as a custom gauge named rpi_cpu_temp_celsius:
rpi_cpu_temp_celsius > 80
Enter fullscreen mode Exit fullscreen mode
The second rule is more valuable: projecting disk exhaustion using predict_linear. This catches slow write leaks — logging misconfiguration, a runaway SQLite database, Docker layer accumulation — long before df -h looks worrying:
# Alert: disk will fill within 24 hours based on 4h trend
# Condition: for 10m (avoids alerting on brief write bursts)
predict_linear(
  node_filesystem_avail_bytes{mountpoint="/", fstype!="tmpfs"}[4h],
  86400   # seconds = 24 hours
) < 0
Enter fullscreen mode Exit fullscreen mode
The silencing gotcha hits every first-time Grafana alerting user: when Prometheus restarts — during an upgrade, after a config reload, during a Pi reboot — Grafana receives no data for that metric and fires the alert with state No Data by default. This causes a false page every time you touch your stack. The fix is buried in the alert rule editor under "Configure no data and error handling": set No data to OK during initial setup and any planned maintenance window. Switch it back to Alerting once you're confident the scrape is stable. It's a per-rule setting, not global, which is the right design — your temperature alert probably should page on no data in production, but your predict_linear disk rule absolutely should not fire just because Prometheus was down for 90 seconds.
Gotchas That Will Cost You an Afternoon
The Prometheus OOM kill on a 2 GB Pi 4 is the first thing that will happen to you, and it will happen silently — the container just disappears and docker ps shows nothing running. The default chunks_head_series limit is effectively unbounded, so Prometheus happily grows its in-memory TSDB head until the kernel OOM killer intervenes. Adding --storage.tsdb.head-chunks-write-queue-size=0 and --query.max-samples=5000000 to your Prometheus flags helps cap runaway query memory, but neither flag fixes the actual problem: WAL writes to a slow SD card create backpressure that keeps more chunks in memory longer than they should be. The real fix is pointing --storage.tsdb.path at a USB SSD. On a Pi 4 with a decent SSD attached over USB 3.0, WAL flush latency drops from hundreds of milliseconds to single digits, and Prometheus memory behavior becomes predictable.
# docker-compose.yml snippet — Prometheus targeting USB SSD mount
services:
  prometheus:
    image: prom/prometheus:v2.51.2
    command:
      - '--config.file=/etc/prometheus/prometheus.yml'
      - '--storage.tsdb.path=/prometheus-data'
      - '--storage.tsdb.retention.time=15d'
      - '--storage.tsdb.head-chunks-write-queue-size=0'
      - '--query.max-samples=5000000'
    volumes:
      # USB SSD mounted at /mnt/usb on the host
      - /mnt/usb/prometheus:/prometheus-data
      - ./prometheus.yml:/etc/prometheus/prometheus.yml:ro
Enter fullscreen mode Exit fullscreen mode
Grafana's SQLite locking errors are a different failure mode but the same root cause: SD card I/O latency. When two browser tabs hit different dashboards simultaneously, Grafana opens concurrent write transactions against grafana.db, and SQLite's file locking stalls long enough that Grafana's own timeout fires first. You'll see database is locked in the container logs and a spinner in the UI that never resolves. Moving the Grafana data directory to a tmpfs path like /tmp/grafana-data does make the locking errors stop — SQLite on RAM is fast enough — but you lose your dashboard config on every reboot. For anything you want to keep, put the volume on the USB drive and set GF_DATABASE_WAL=true in your environment block, which at least enables WAL mode and reduces lock contention.
services:
  grafana:
    image: grafana/grafana:10.4.2
    environment:
      - GF_DATABASE_WAL=true
      - GF_PATHS_DATA=/var/lib/grafana
    volumes:
      # Same USB SSD, different subdirectory
      - /mnt/usb/grafana:/var/lib/grafana
Enter fullscreen mode Exit fullscreen mode
Time sync problems produce some of the most confusing Prometheus behavior: graphs with gaps, negative rate calculations, and counters that appear to reset. On Raspberry Pi OS Lite, systemd-timesyncd is enabled by default, but if you've also installed ntp or chrony at any point, you can end up with two daemons fighting over the clock. Run timedatectl status and look at the NTP service line — if it says active but timedatectl timesync-status shows stale sync timestamps, something is blocking timesyncd. The clean fix is picking one daemon and fully disabling the other: sudo systemctl disable --now ntp followed by sudo systemctl enable --now systemd-timesyncd. Prometheus itself timestamps scraped metrics at the moment of the HTTP response, so even a 30-second clock jump introduces gaps that look like node failures in your dashboards.
ARM64 image availability is the gotcha that bites you late, after you've built out half your stack. prom/prometheus, prom/node-exporter, and grafana/grafana all publish proper linux/arm64 manifests and the images run natively on Pi 4 and Pi 5 without emulation. The problem is community exporters — things like MySQL exporters from third-party registries, or Homebridge metric plugins, or anything that hasn't seen a release in 18 months. Before adding any exporter to your docker-compose.yml, run:
docker manifest inspect prom/mysqld-exporter:v0.15.1 | grep architecture
# Expected output includes:
#   "architecture": "arm64"
# If you only see "amd64", you're running under QEMU emulation
# which means 3-5x slower scrape handling and potential segfaults
Enter fullscreen mode Exit fullscreen mode
QEMU emulation on Docker Desktop or via binfmt_misc on the Pi itself won't crash immediately — the container starts fine, metrics appear to scrape, and everything looks normal until load increases or you hit a specific syscall that QEMU emulates incorrectly. Check the architecture before you wire something into your alert rules and depend on it being accurate.
Disclaimer: This article is for informational purposes only. The views and opinions expressed are those of the author(s) and do not necessarily reflect the official policy or position of Sonic Rocket or its affiliates. Always consult with a certified professional before making any financial or technical decisions based on this content.
Originally published on techdigestor.com. Follow for more developer-focused tooling reviews and productivity guides.
0 Comments
Log in to join the conversation.No comments yet. Be the first to share your thoughts.