
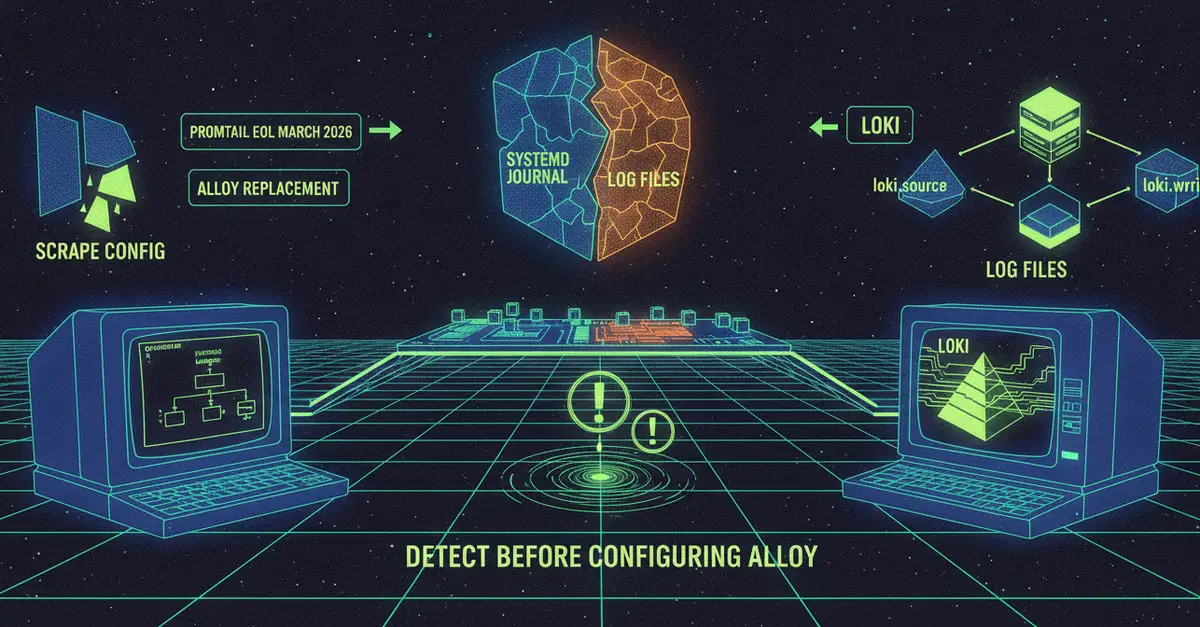
TL;DR: Promtail reached end of life in March 2026, making Alloy the supported replacement for shipping logs to Loki. The migration is mostly a matter of replacing Promtail's scrape configuration with
loki.source.*,loki.process, andloki.writecomponents. The biggest pitfall isn't the configuration itself—it's assuming how a host writes logs. Detect whether a machine uses the systemd journal or log files before configuring Alloy, or you may end up silently collecting nothing.
In this article I discussed moving host metrics from a scraped node_exporter to a push-based Alloy agent, and followed it up with a piece comparing Alloy against Prometheus Agent mode. Both of those articles discussed metrics and how they move between the host and client nodes. This post covers the log-shipping portion of the same story, and it has a deadline attached that the metrics migration didn't.
Promtail reached end of life on March 2, 2026. It continues to function, but it no longer receives bug fixes or security updates. If you are shipping logs to Loki with Promtail today, you are running an unmaintained agent, and the replacement Grafana points you at is the same Alloy you may already be running for metrics. If you're already running Alloy for metrics, the log migration is mostly adding components to a config that already exists. If you're not, this article will strengthen the case for consolidating onto Alloy rather than running a separate, now-unmaintained log agent.
             Promtail

  Journal/File Logs
         │
         ▼
     Promtail
         │
         ▼
       Loki


             Alloy

 Journal/File Logs
         │
         ▼
  loki.source.*
         │
         ▼
   loki.process
         │
         ▼
    loki.write
         │
         ▼
        Loki
Enter fullscreen mode Exit fullscreen mode
What actually changes
Promtail is a standalone binary with its own YAML config: scrape_configs, clients, and a positions file, built for one job. Alloy replaces that YAML configuration with a component-based pipeline. The host produces log entries, Alloy processes them if required, and forwards them to Loki. There are three component types, all wired together with forward_to references.
| Promtail | Alloy |
|---|---|
| Journal scrape | loki.source.journal |
| File scrape | loki.source.file |
| Pipeline stages | loki.process |
clients |
loki.write |
Between the source and destination, loki.process handles parsing, filtering, label manipulation, and other pipeline stages that previously lived inside Promtail.
The journal case
loki.source.journal "systemd_journal" {
  forward_to = [loki.process.add_labels.receiver]
}
Enter fullscreen mode Exit fullscreen mode
The source reads the journal and hands each line to a loki.process component named add_labels, which is where I attach the same tenant, cluster, environment, and role labels that ride along with the metrics from that host to help maintain separation between clients. You can read more about my tenant isolation model here. Labeling logs and metrics identically at the edge is what lets me line them up later in Grafana, and it is worth getting consistent from the first host rather than fixing it in queries forever after.
The file-based case
local.file_match "logs" {
  path_targets = [
    {"__path__" = "/var/log/syslog"},
    {"__path__" = "/var/log/auth.log"},
    {"__path__" = "/var/log/messages"},
    {"__path__" = "/var/log/secure"},
  ]
}

loki.source.file "log_scrape" {
  targets    = local.file_match.logs.targets
  forward_to = [loki.process.add_labels.receiver]
}
Enter fullscreen mode Exit fullscreen mode
local.file_match resolves glob patterns into concrete targets, and loki.source.file tails whatever it finds. I list both Debian-family paths and RHEL-family paths because which files exist depends on the distro, and missing paths are simply skipped. In practice I detect which log method a host actually uses at install time and inject only the matching block.
The trap: don't guess the log method by distro
I learned this lesson the hard way. I assumed Debian meant /var/log/syslog and RHEL meant journald.
I thought the obvious way to decide between journal and file collection was to base it on distro family. That doesn't cover edge cases. Plenty of Debian systems have rsyslog disabled or absent and log only to the journal, while some hosts have been configured differently by whoever set them up. Alloy starts cleanly, reports itself healthy, and quietly ships no logs because it is watching the wrong source. The first indication anything is wrong is often during an incident, when the logs you expected simply aren't there.
What actually works is an empirical check. Determine whether the host is actively writing journal entries or log files, then configure Alloy accordingly.
Migrating without a gap
Stand up Alloy's log collection alongside Promtail rather than cutting over immediately. Both can ship to the same Loki, and the extra resource overhead is negligible. You will get some duplicate lines during the overlap, which is a much better failure mode than a hole in your logs. Confirm in Grafana that the Alloy-sourced logs are arriving with the correct labels, then remove Promtail.
Loki deduplicates identical log entries that share the same labels. If Alloy adds even one different label, the same log line becomes part of a different stream and both copies remain visible. Match your label set before tearing the old agent down.
Where this leaves you
If you already migrated metrics to Alloy, adding log collection is just a handful of additional components. If you are still on Promtail, the March 2026 end-of-life date makes this migration worth prioritizing. The migration itself is straightforward. The only genuinely dangerous part is the silent-failure trap, and that's avoidable if you verify how each host actually writes logs instead of assuming based on its distro.
If you've already made this move, I'm curious whether you ran into the journal-versus-file mismatch too, or whether your fleet was uniform enough that the distro heuristic held.
0 Comments
Log in to join the conversation.No comments yet. Be the first to share your thoughts.