
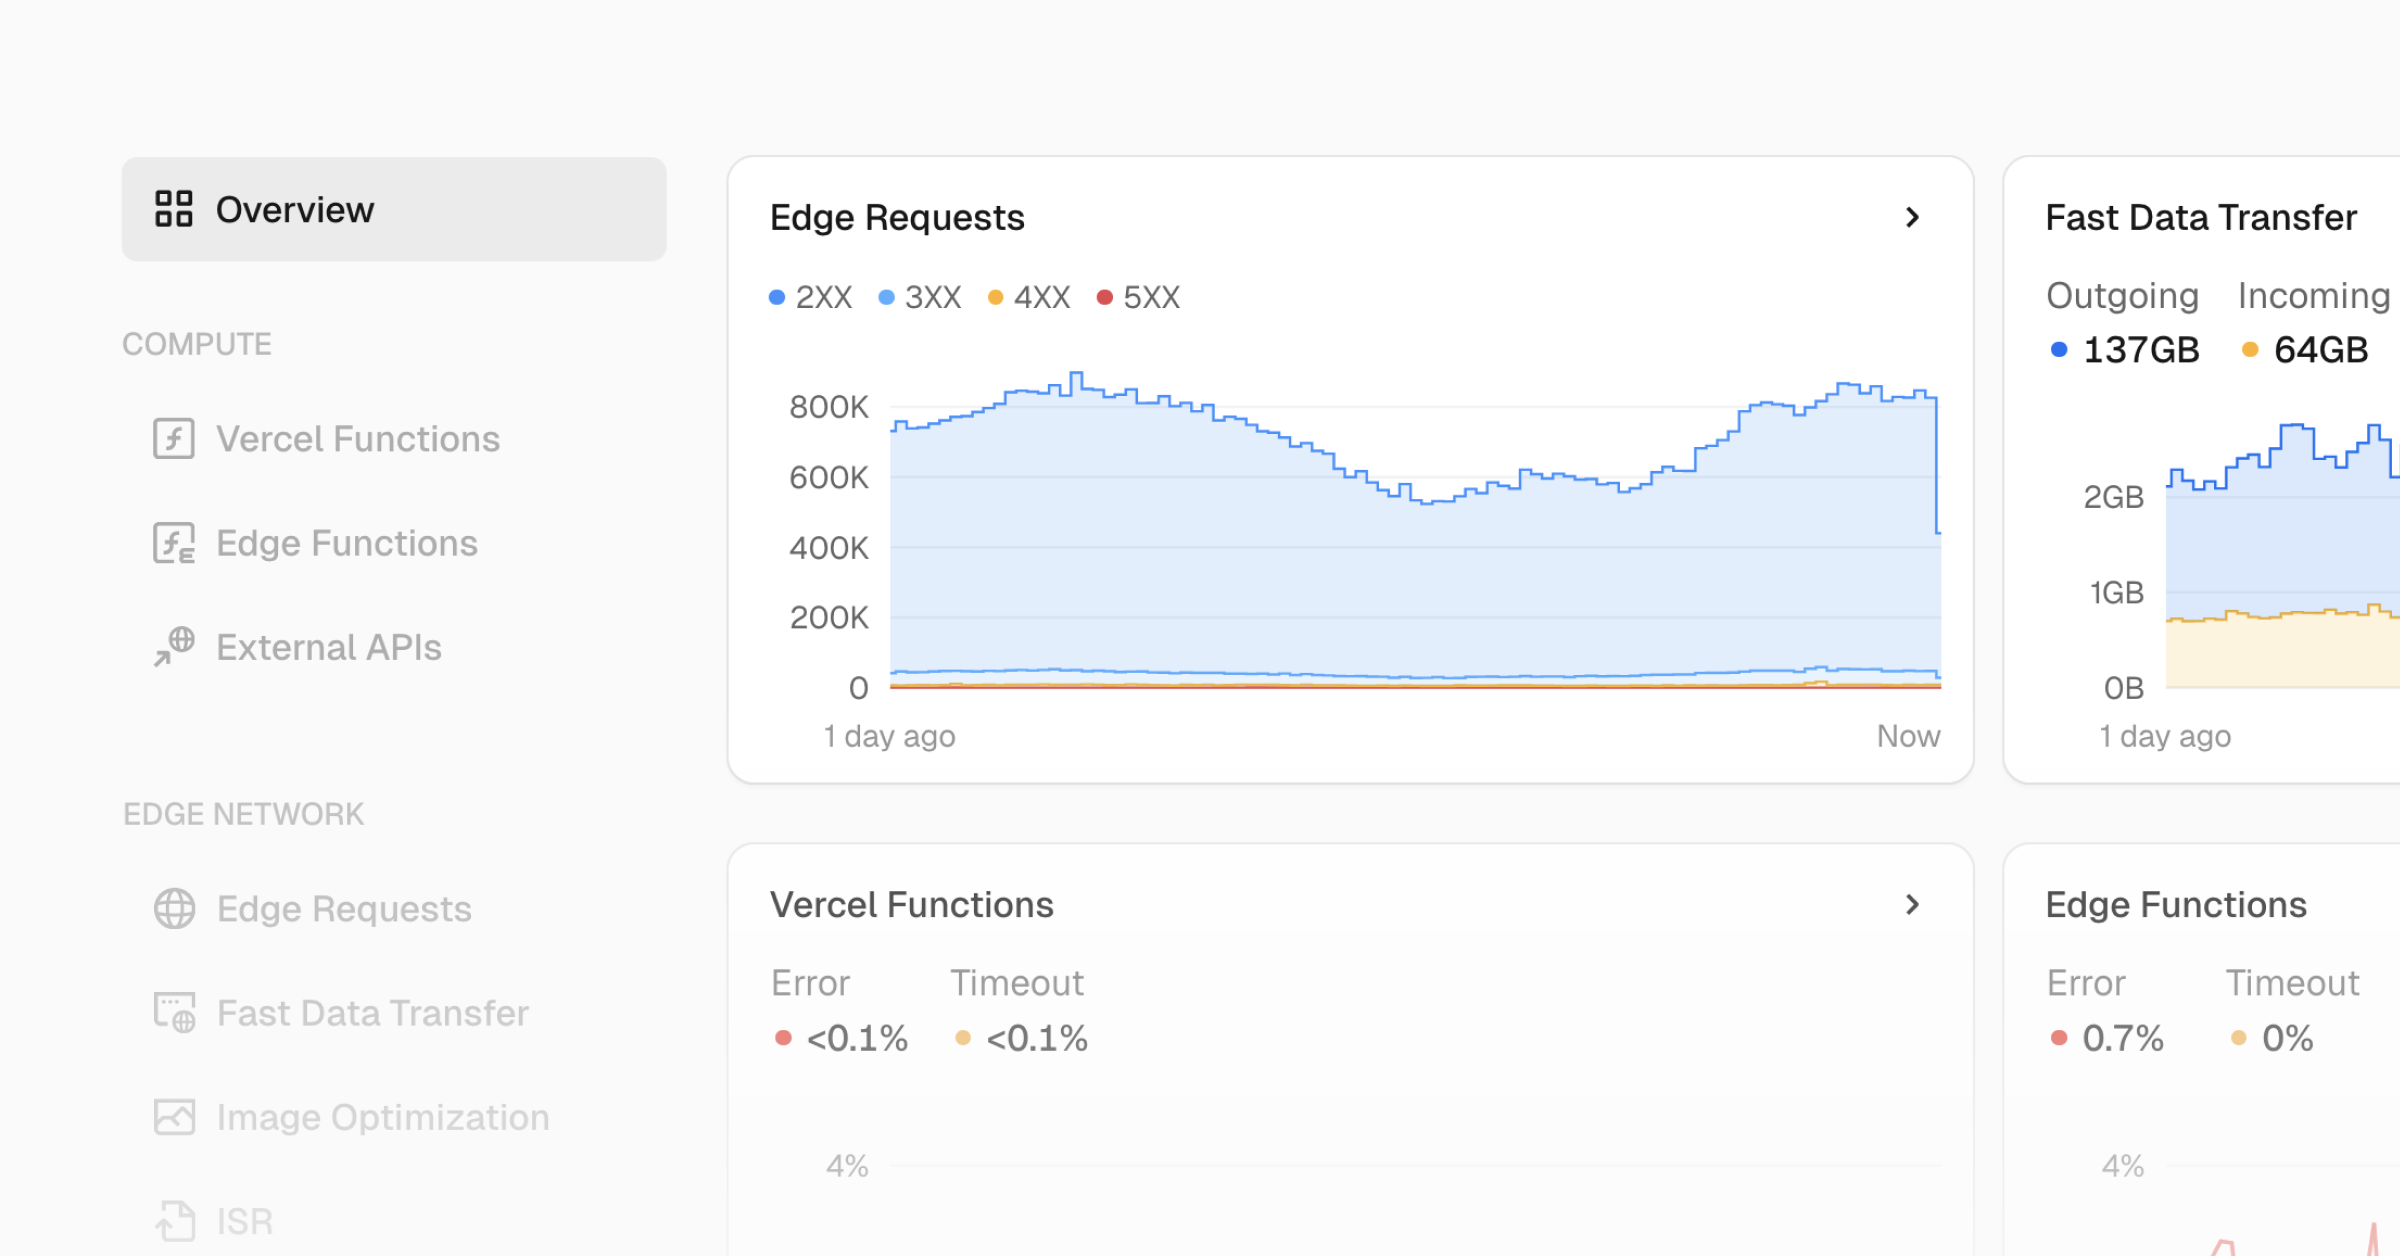
Vercel Observability now includes an overview page that provides a high-level view of your application's performance.
This new dashboard aggregates key metrics from Edge Requests, Fast Data Transfer, and Vercel Functions, giving you instant insights into request and data transfer volumes, as well as function performance.
Each metric also serves as a starting point for deeper analysis, with one-click access to their dedicated dashboards for more detailed insights.
Try it in your Observability dashboard.
0 Comments
Log in to join the conversation.No comments yet. Be the first to share your thoughts.