
Look at the analytics setup of almost any Laravel SaaS and you'll find the same thing: three tools, three logins, three versions of the truth.
There's a traffic tool (Google Analytics, or Plausible or Fathom if the team cares about privacy) that counts visitors and sessions. There's a subscription-analytics tool (ChartMogul, Baremetrics, ProfitWell) bolted onto Stripe to turn charges into MRR and churn. And there's an ad pixel (the Meta or Google tag) dropped into the frontend so the ad platforms can attribute conversions.
Each one does its job. The problem is what happens between them: nothing. They don't share data, they don't share a definition of a "customer", and not one of them can answer the question that actually decides where next month's budget goes.
This post is the case for collapsing that stack into one, server-side, built for Laravel. It's what we built SimpleStats for. Not because three tabs is one too many, but because the value was hiding in the gaps between them all along.
The Three Tools You're Duct-Taping Together
It's worth being precise about what each layer actually knows, because the blind spots are the whole story.
The traffic layer (Fathom, Plausible, GA) knows where people come from and what they look at. It sees utm_campaign, referrers, pageviews. What it deliberately does not see is money. Fathom and Plausible don't touch revenue by design; GA sees, at best, a client-side conversion event, and 30 to 50% of even that is eaten by ad blockers before it arrives.
The revenue layer (ChartMogul, Baremetrics, ProfitWell) knows money in exquisite detail. Every charge, every upgrade, every cancellation, turned into MRR, churn and LTV. What it has never heard of is a marketing channel. Stripe doesn't know your utm_campaign, so nothing built on top of Stripe does either.
The attribution layer (the Meta / Google pixel) tries to bridge the two, but only for the platform's own benefit and only client-side. It fires when someone converts, reports back to the ad platform, and gets blocked by the same ad blockers as everything else. It optimizes ad delivery. It does not give you a clean, honest table of profit per channel.
So you end up with three dashboards, each holding one third of the picture, and a quarterly spreadsheet where someone tries to staple them together by hand.
Why Three Tools Is Worse Than the Sum
The instinct is to think "three tools, three jobs, fine." But the numbers that actually run a subscription business live between the tools, not inside any one of them:
- Which campaign brings customers who stay? Needs traffic (channel) and revenue (retention). No single tool has both.
- What is a customer from the newsletter actually worth? Needs channel attribution and LTV. Split across two tools that don't share an ID.
- Is this campaign profitable after ad spend and churn? Needs all three layers at once.
Every one of those requires joining data across tools that were never designed to be joined. And the join is brutal: the traffic tool identifies people by a client-side cookie, the revenue tool by a Stripe customer ID, the pixel by its own anonymous ID. Reconciling them is manual, lossy, and stale the moment it's done.
The result is a stack that can tell you how much traffic and how much revenue, but never reliably connects a specific euro of revenue back to the specific campaign that earned it. That connection is the single most valuable thing an analytics stack can give a SaaS, and the three-tool setup is structurally incapable of it.
The One Thing That Ties It Together
SimpleStats takes a different starting point. Instead of three tools each watching one slice from the outside, it tracks the whole customer journey as one connected chain, server-side, from inside your Laravel app:
visitor → registration → login → payment
Because all four are captured in the same place and linked to the same visitor, every downstream number inherits the acquisition context for free. A payment isn't just a payment, it's a payment from the visitor who arrived via utm_campaign=spring-sale from Germany six weeks ago. Nothing has to be reconciled after the fact, because it was never separate to begin with.
And because it happens on the server, there's no pixel, no cookie banner for the analytics, and no ad-blocker hole. The data is complete, which is the quiet prerequisite for every other number being trustworthy.
That single design choice is what lets one tool do the job of three, without the gaps.
The Same Stack, in One Place
Here's how the three familiar layers map onto a single server-side tool.
Traffic analytics (the Fathom job)
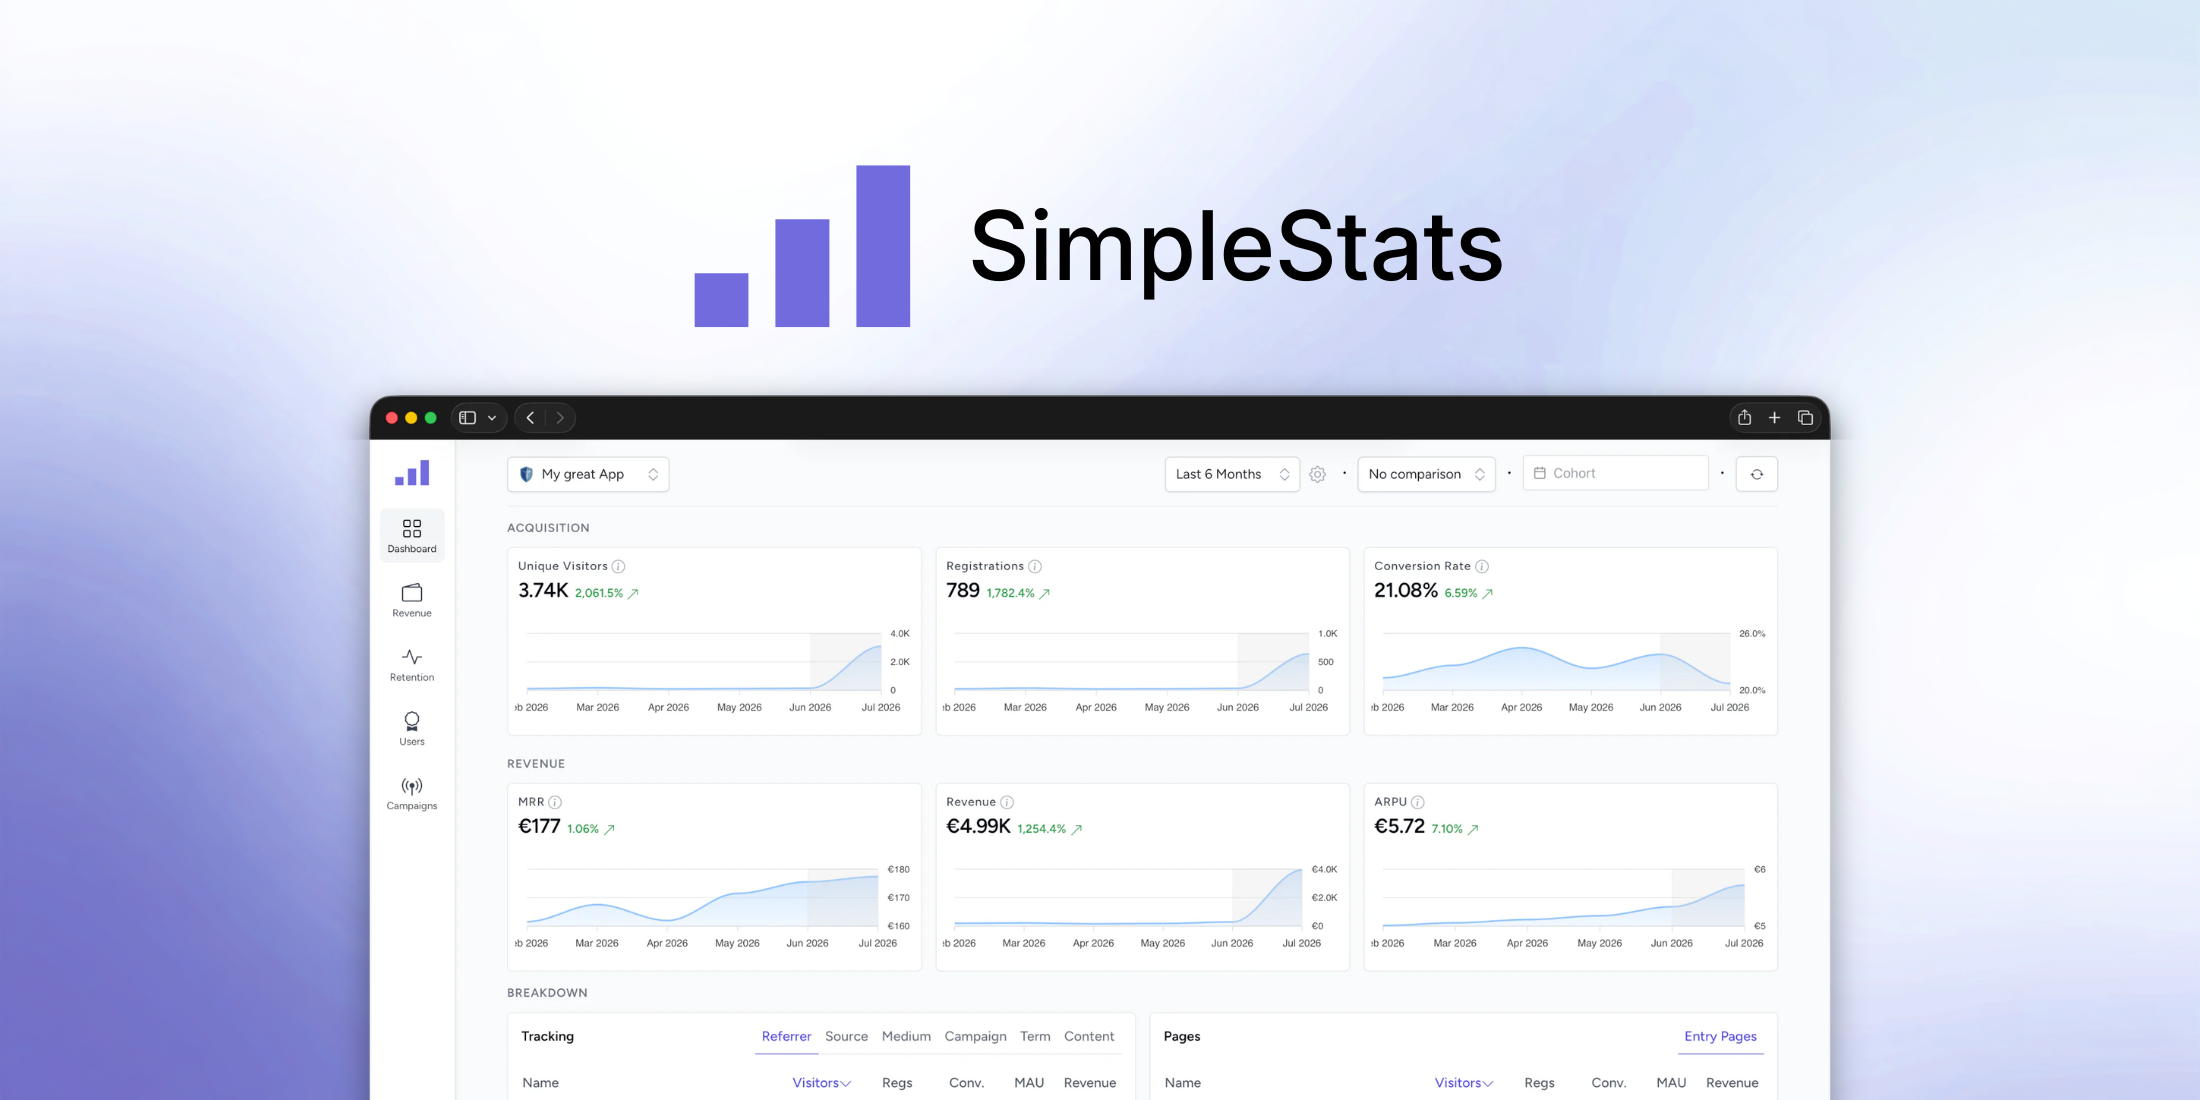
Unique visitors, sources, campaigns, countries, devices, conversion rate. The privacy-first web analytics you'd expect, GDPR-compliant and unaffected by ad blockers because it's server-side. This is the base of the funnel, and every metric above it can be sliced by these same dimensions.
Subscription metrics (the ChartMogul job)
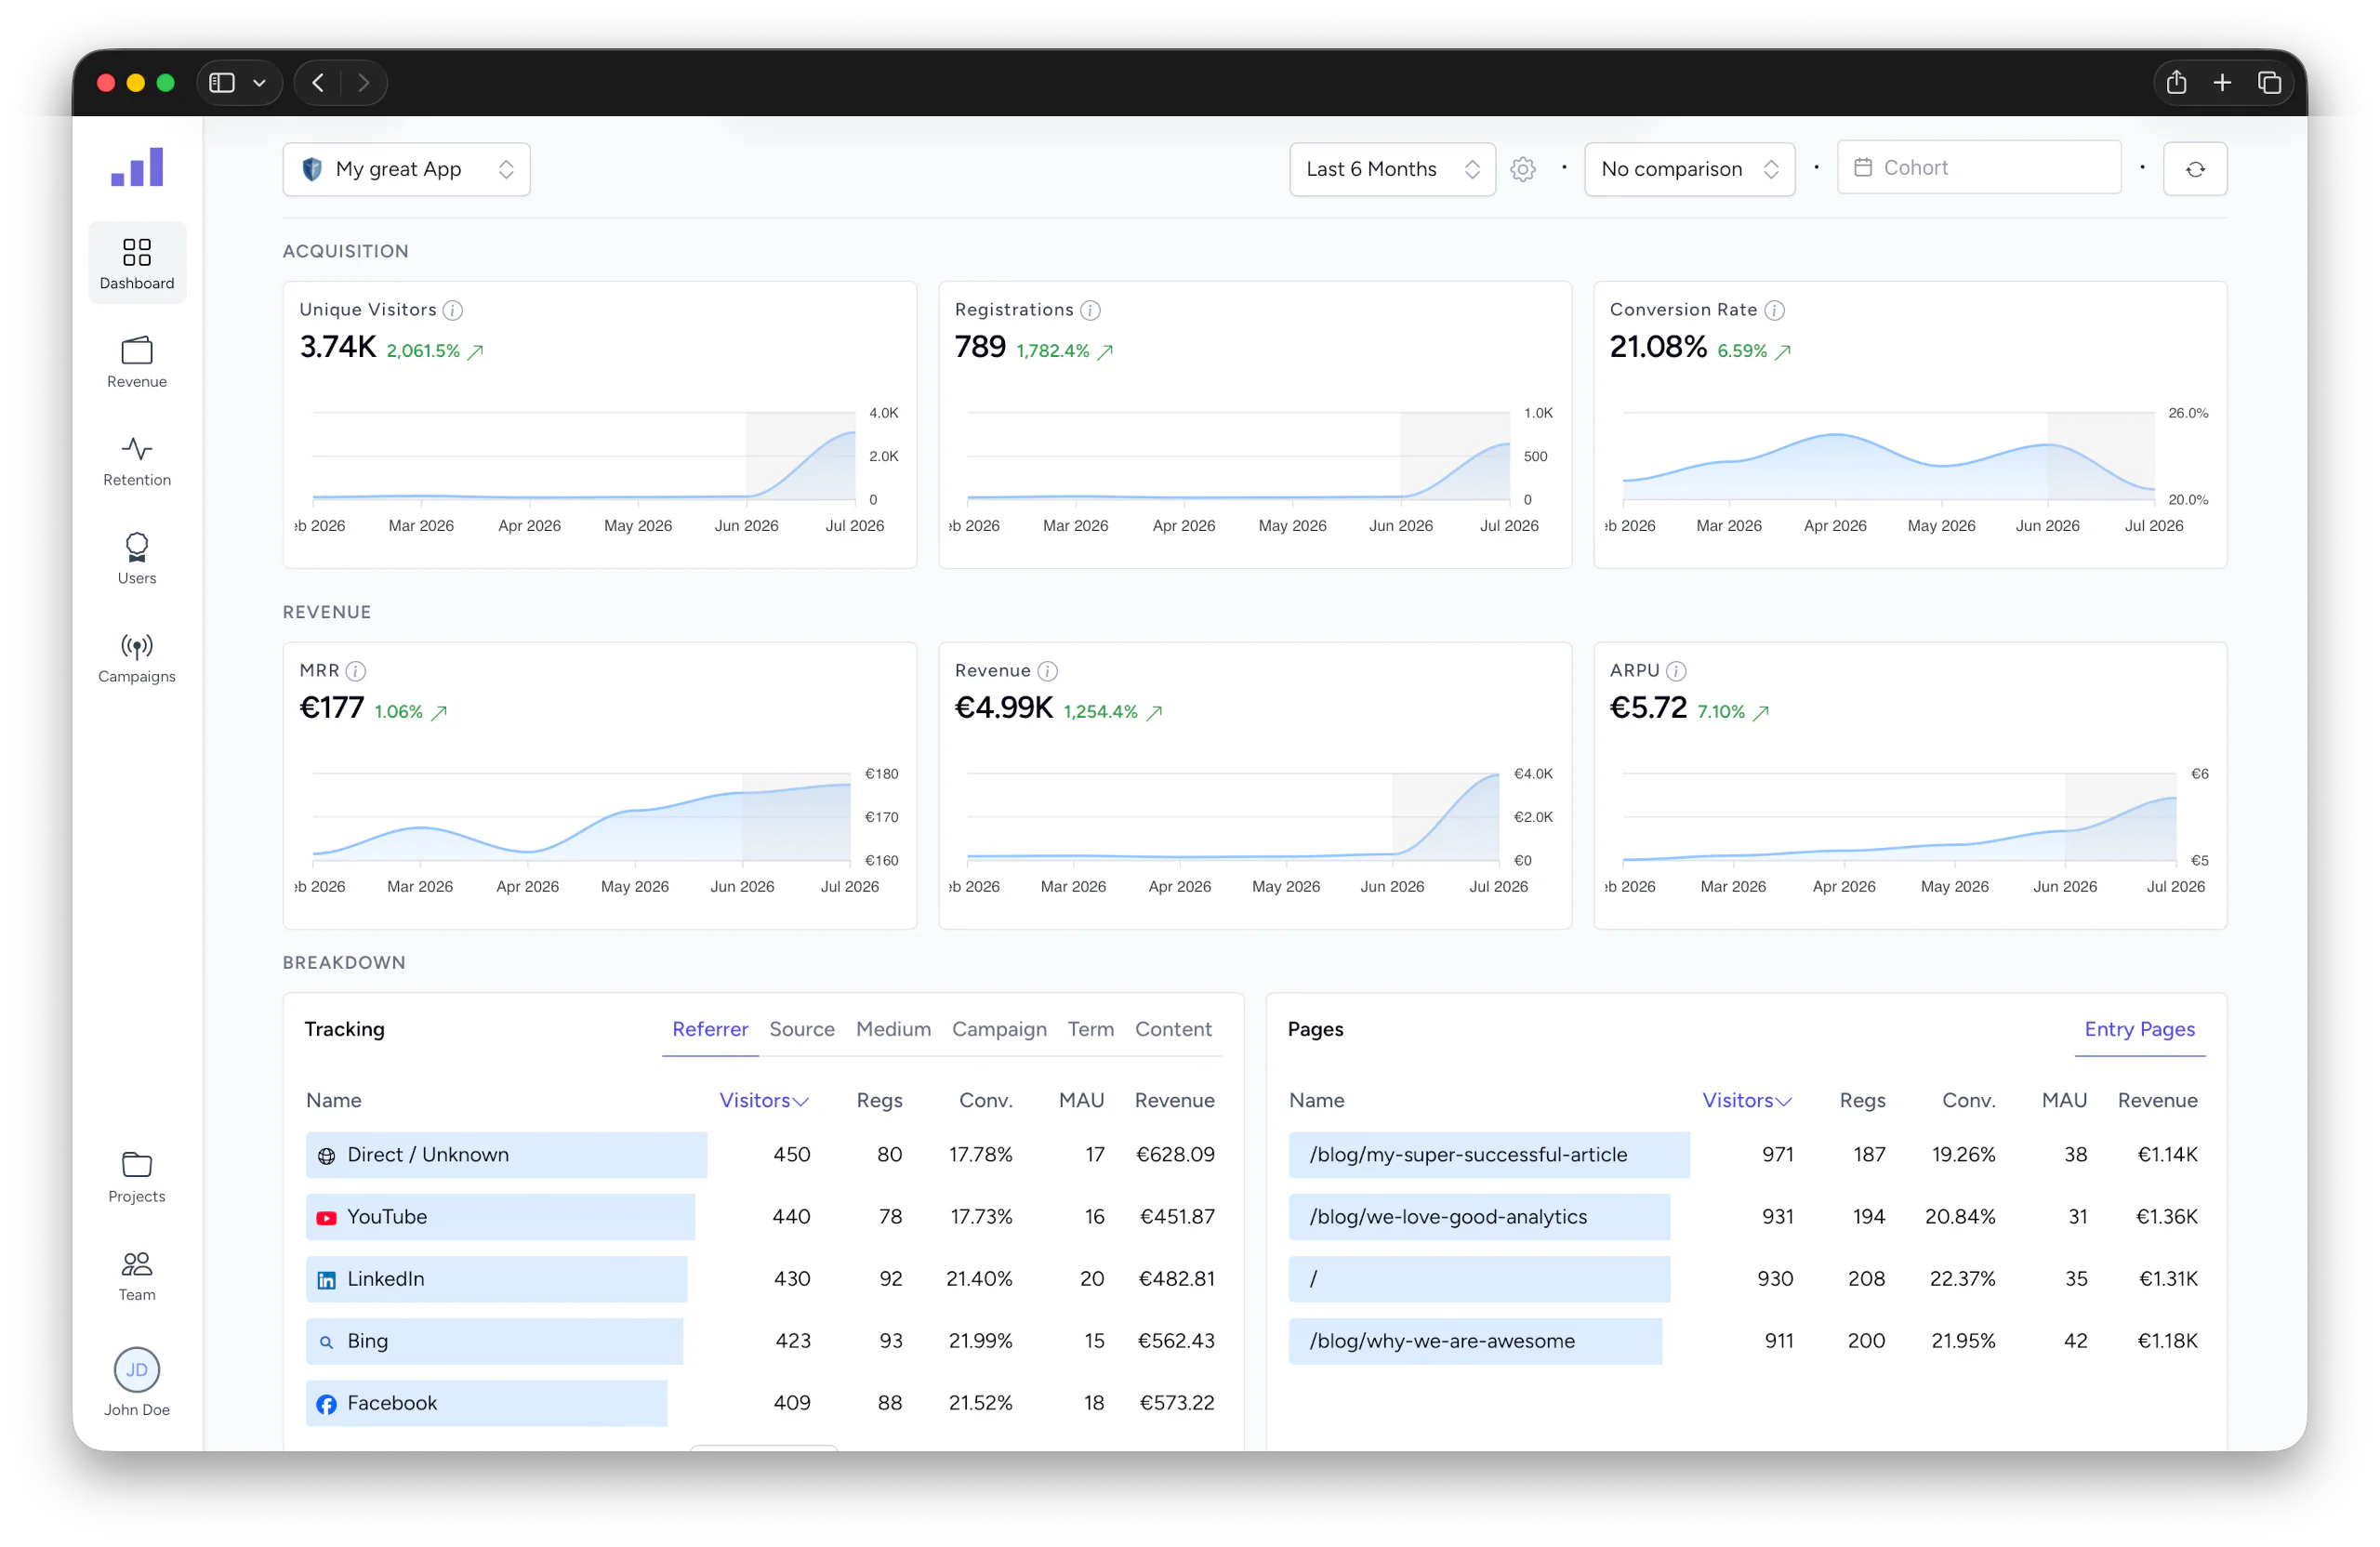
MRR and ARR, MRR movements (new, expansion, contraction, churn, reactivation), Net and Gross Revenue Retention, Quick Ratio, revenue churn and LTV. The full subscription dashboard you'd otherwise pay a separate tool for. The difference: every one of these can be filtered by the channel the customers came from. We go deep on this in SaaS Metrics for Laravel.
Campaign profit (the ad-pixel job, done right)
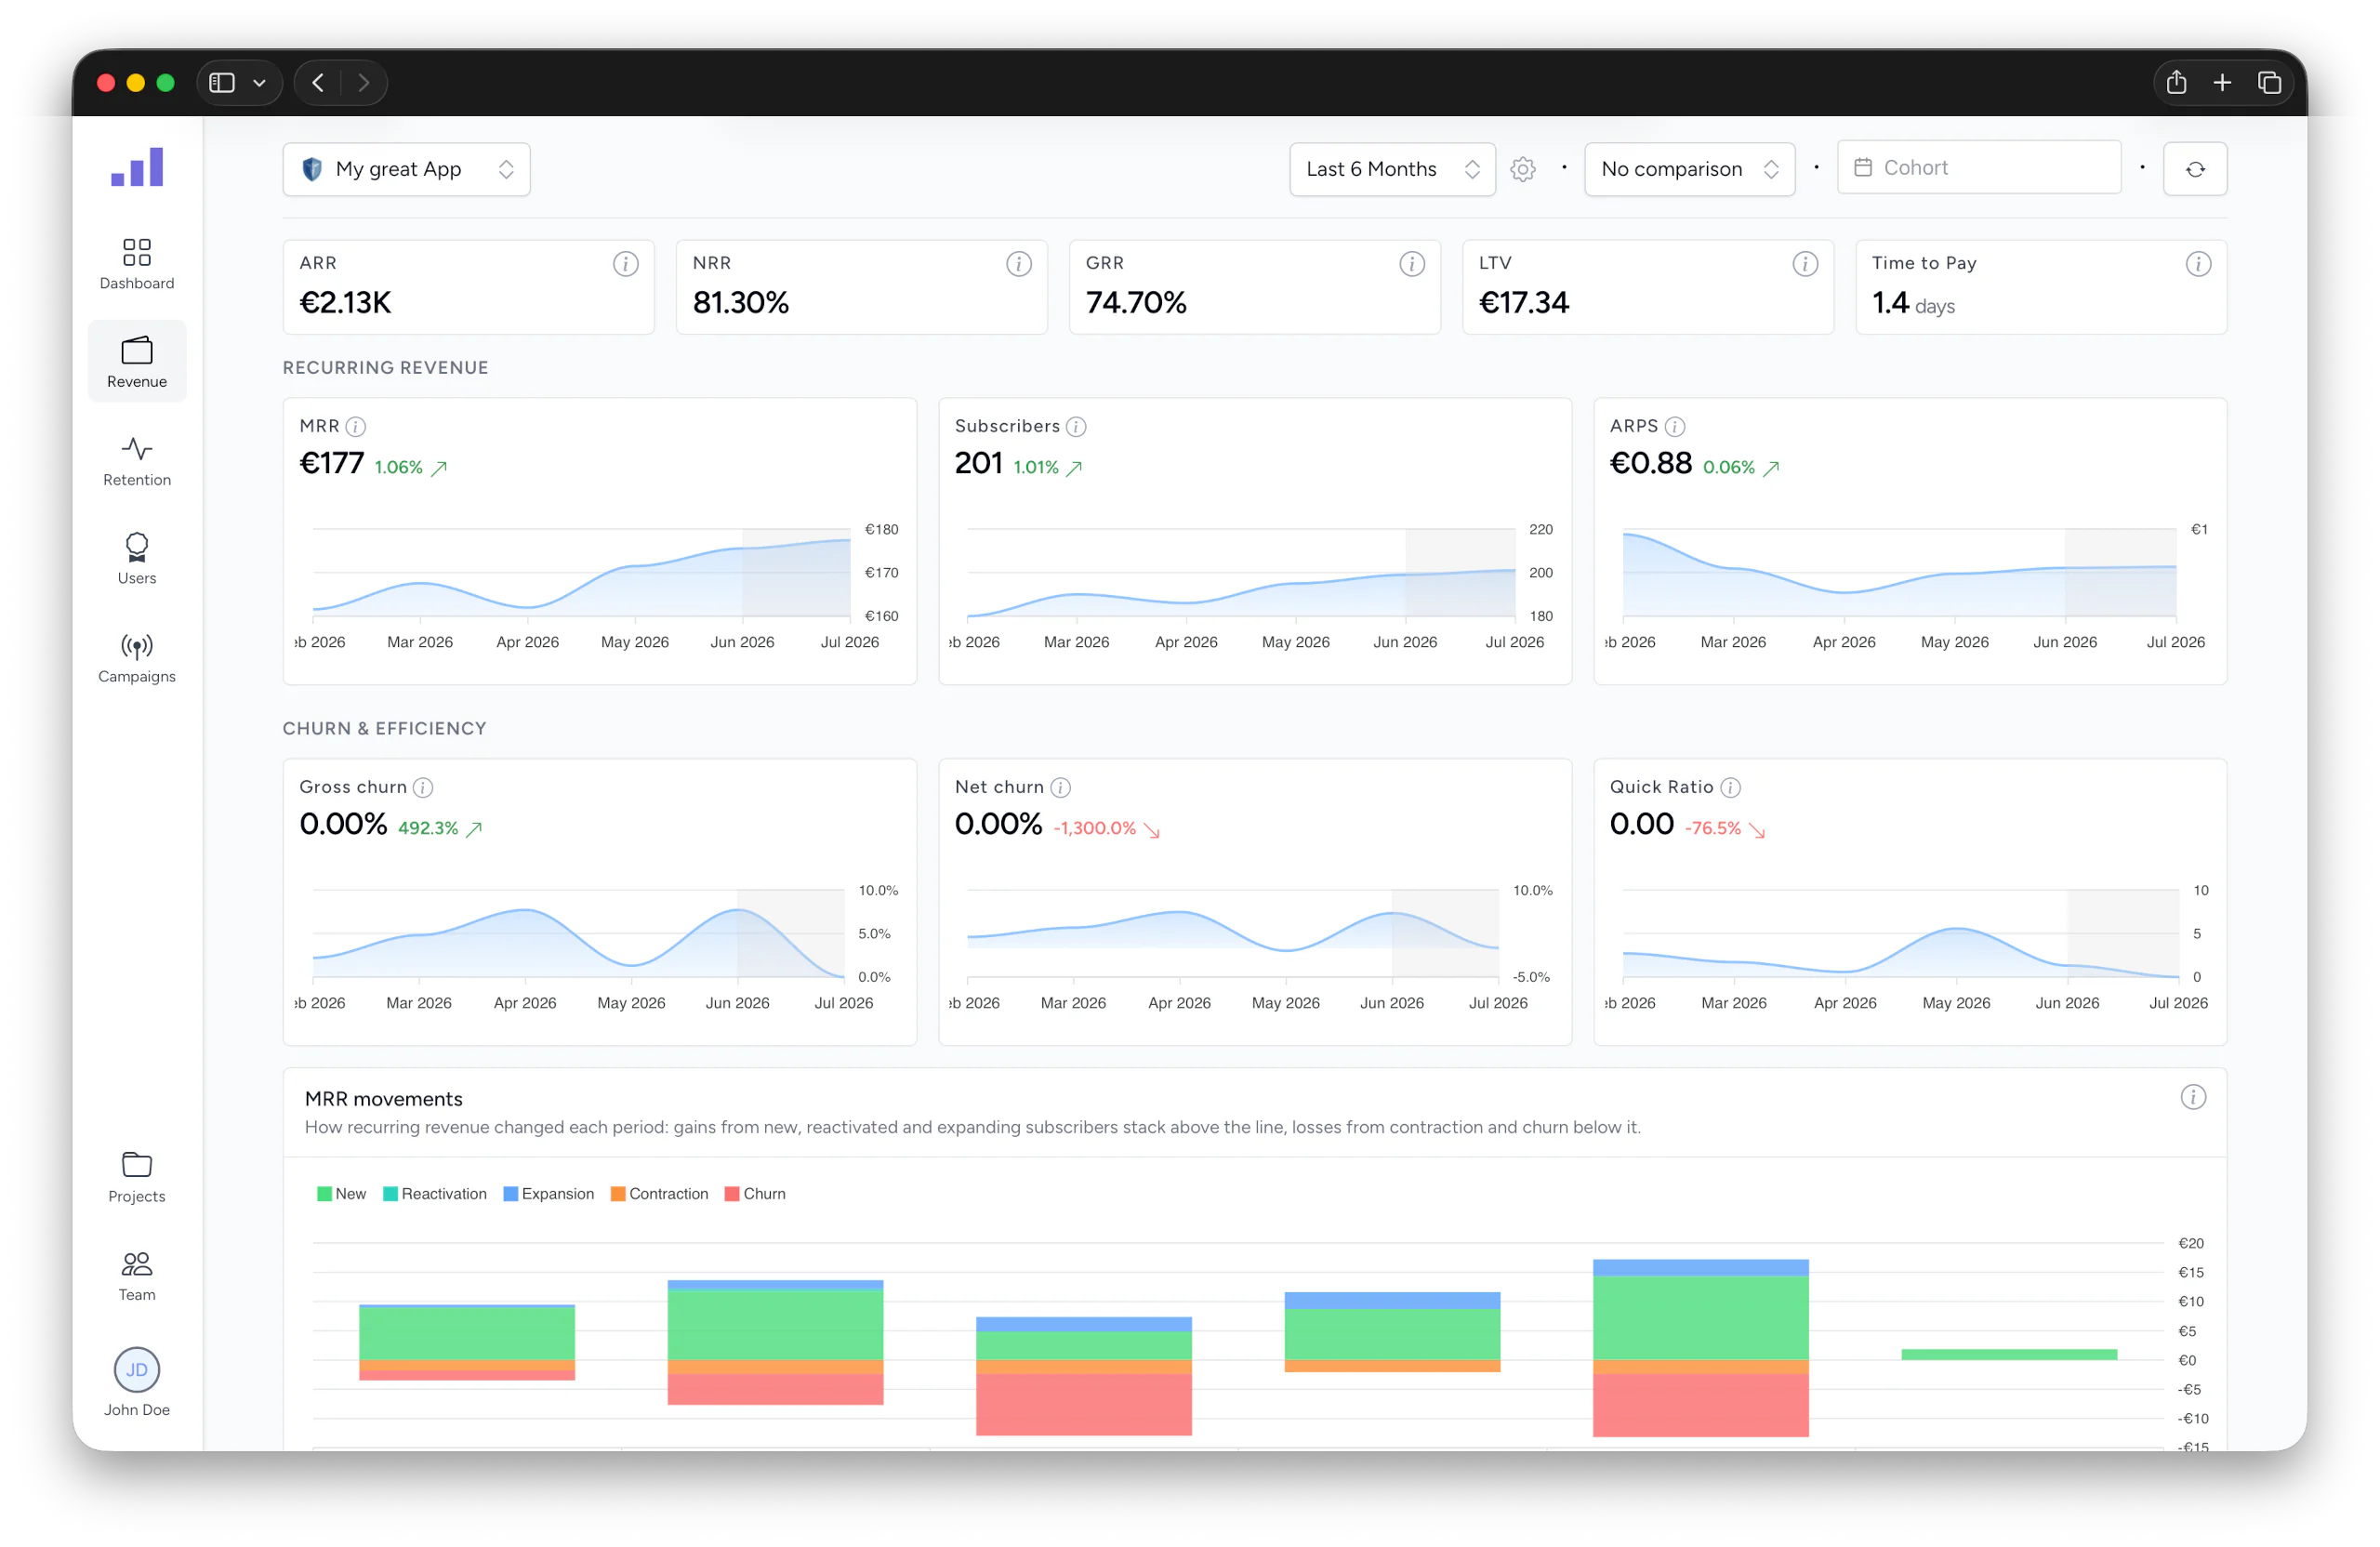
Enter your ad spend per campaign and you get ROAS, CAC, net profit, LTV:CAC and CAC-payback per channel, computed from revenue that's already attributed to the campaign that earned it. This is what the pixel was always supposed to give you and never quite did. The full breakdown is in Marketing ROI for Laravel.
Retention per channel (the part nobody else has)
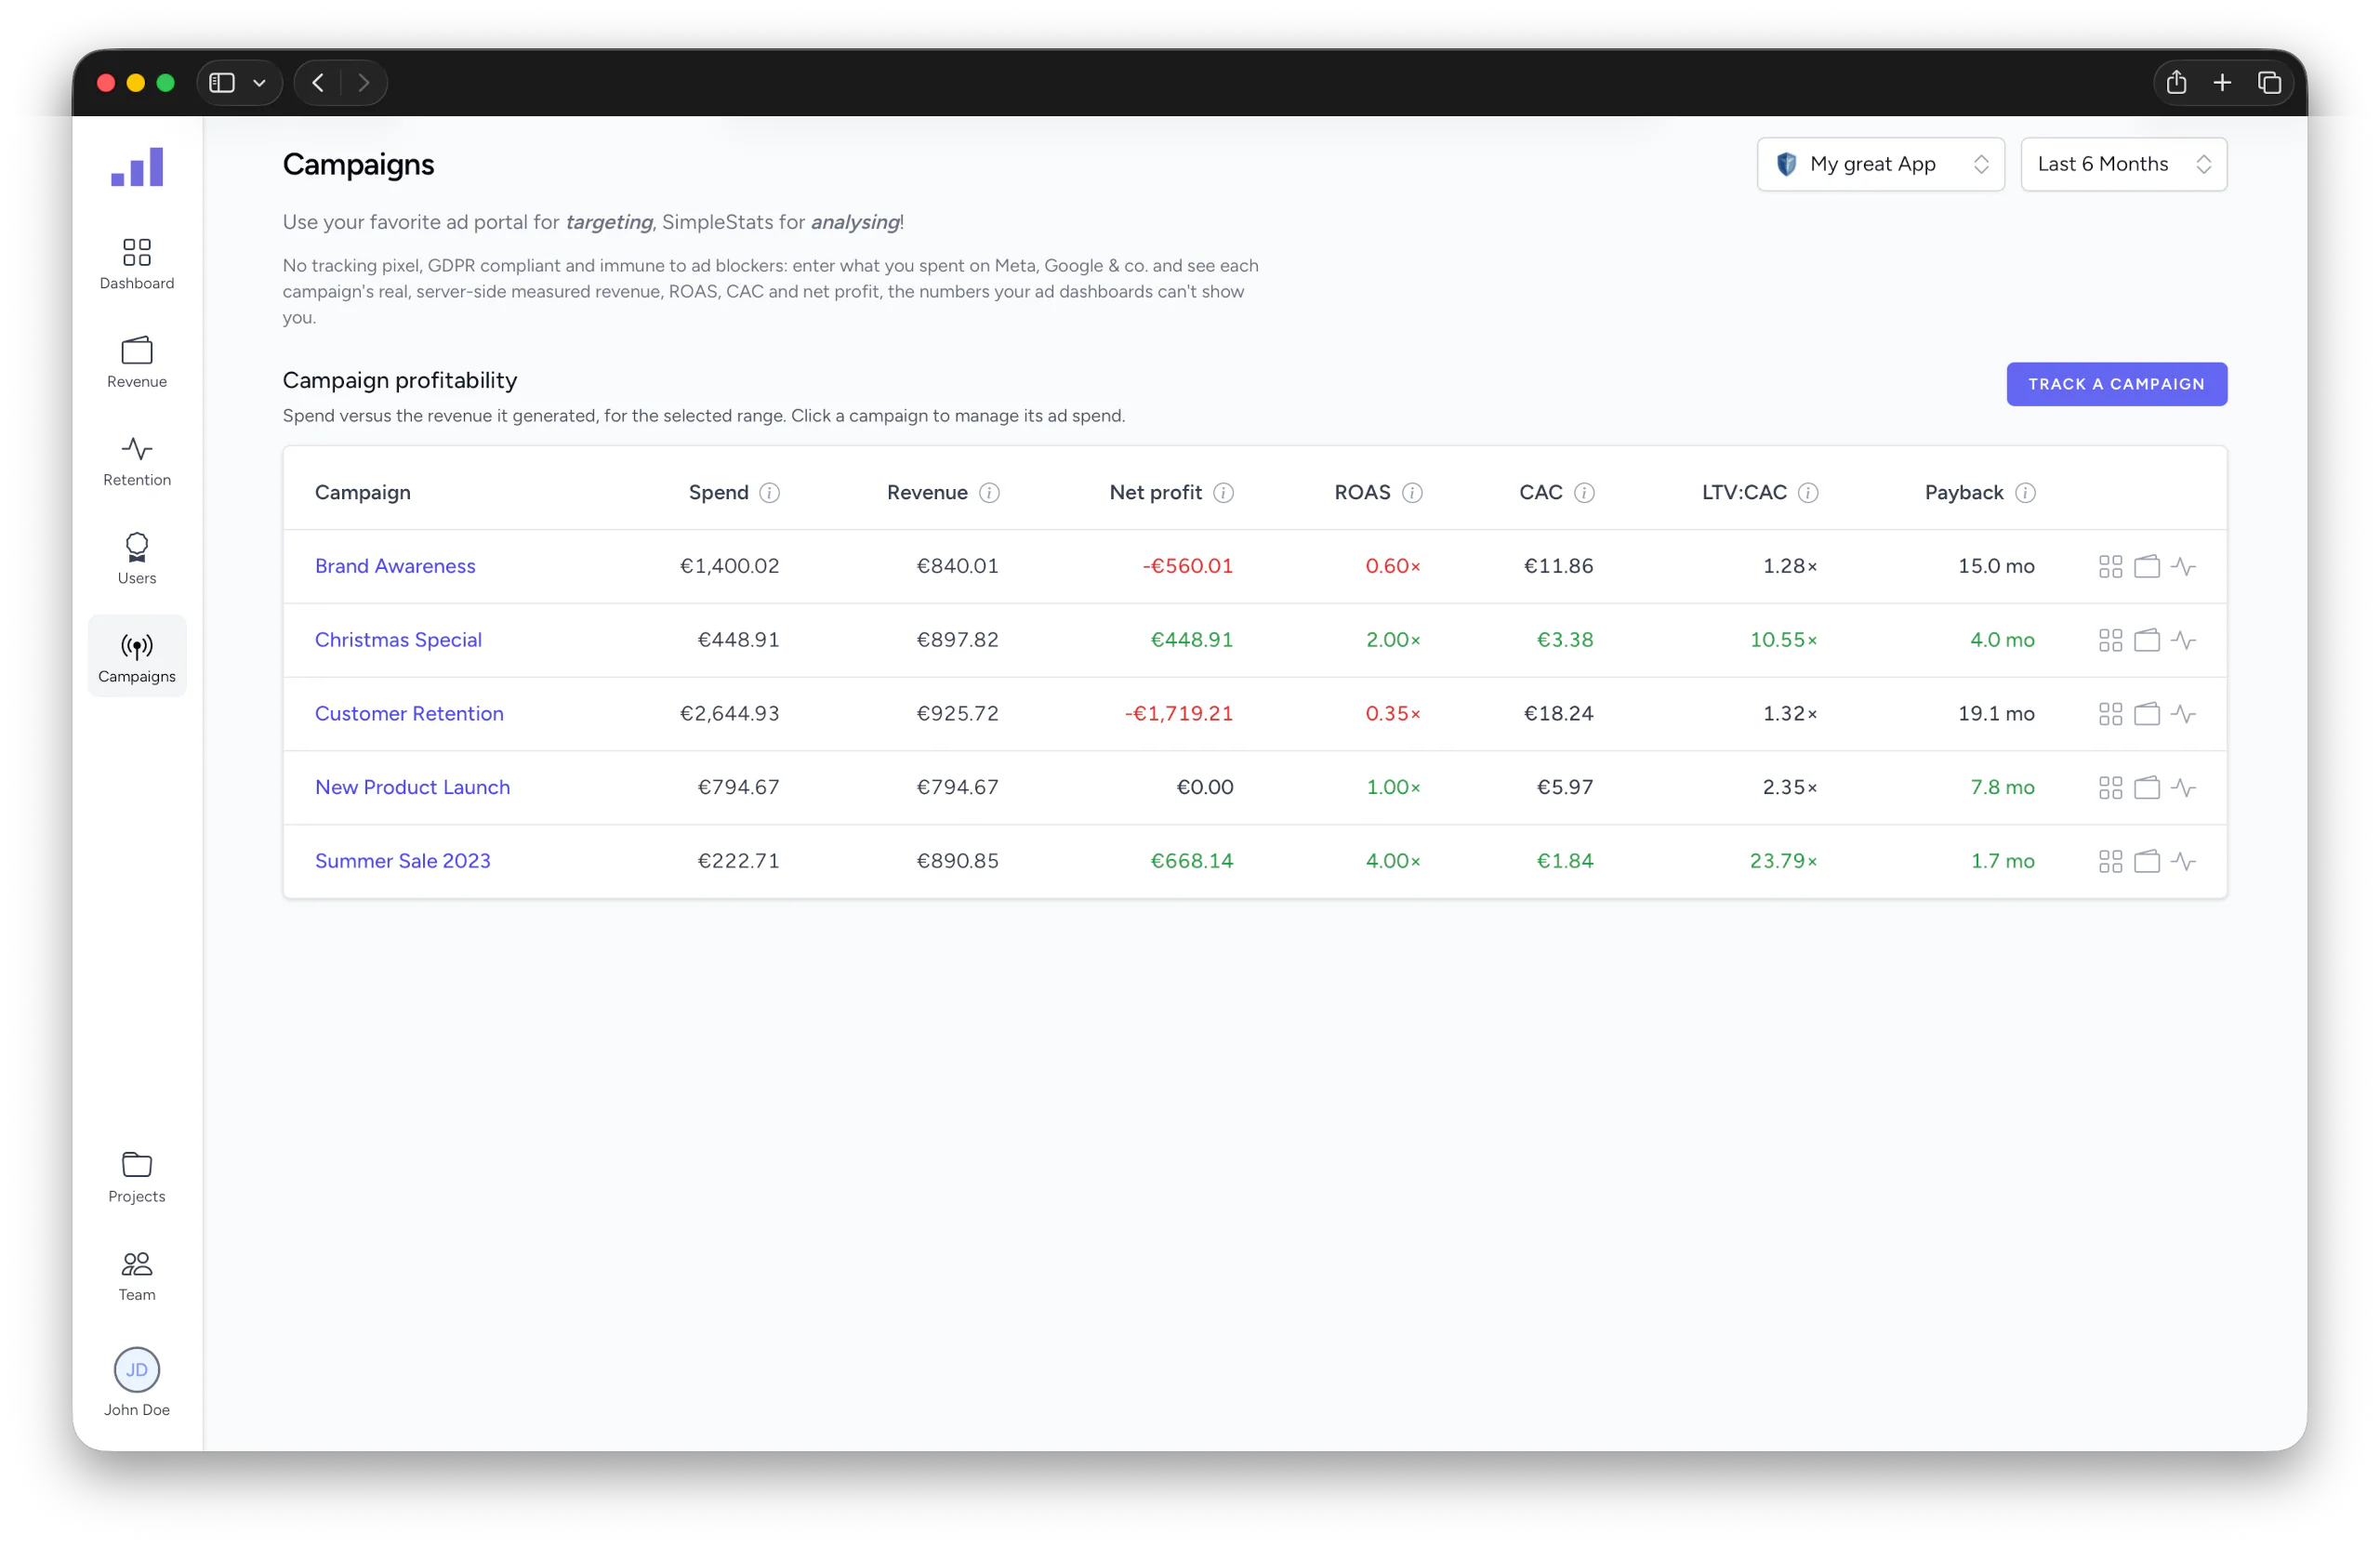
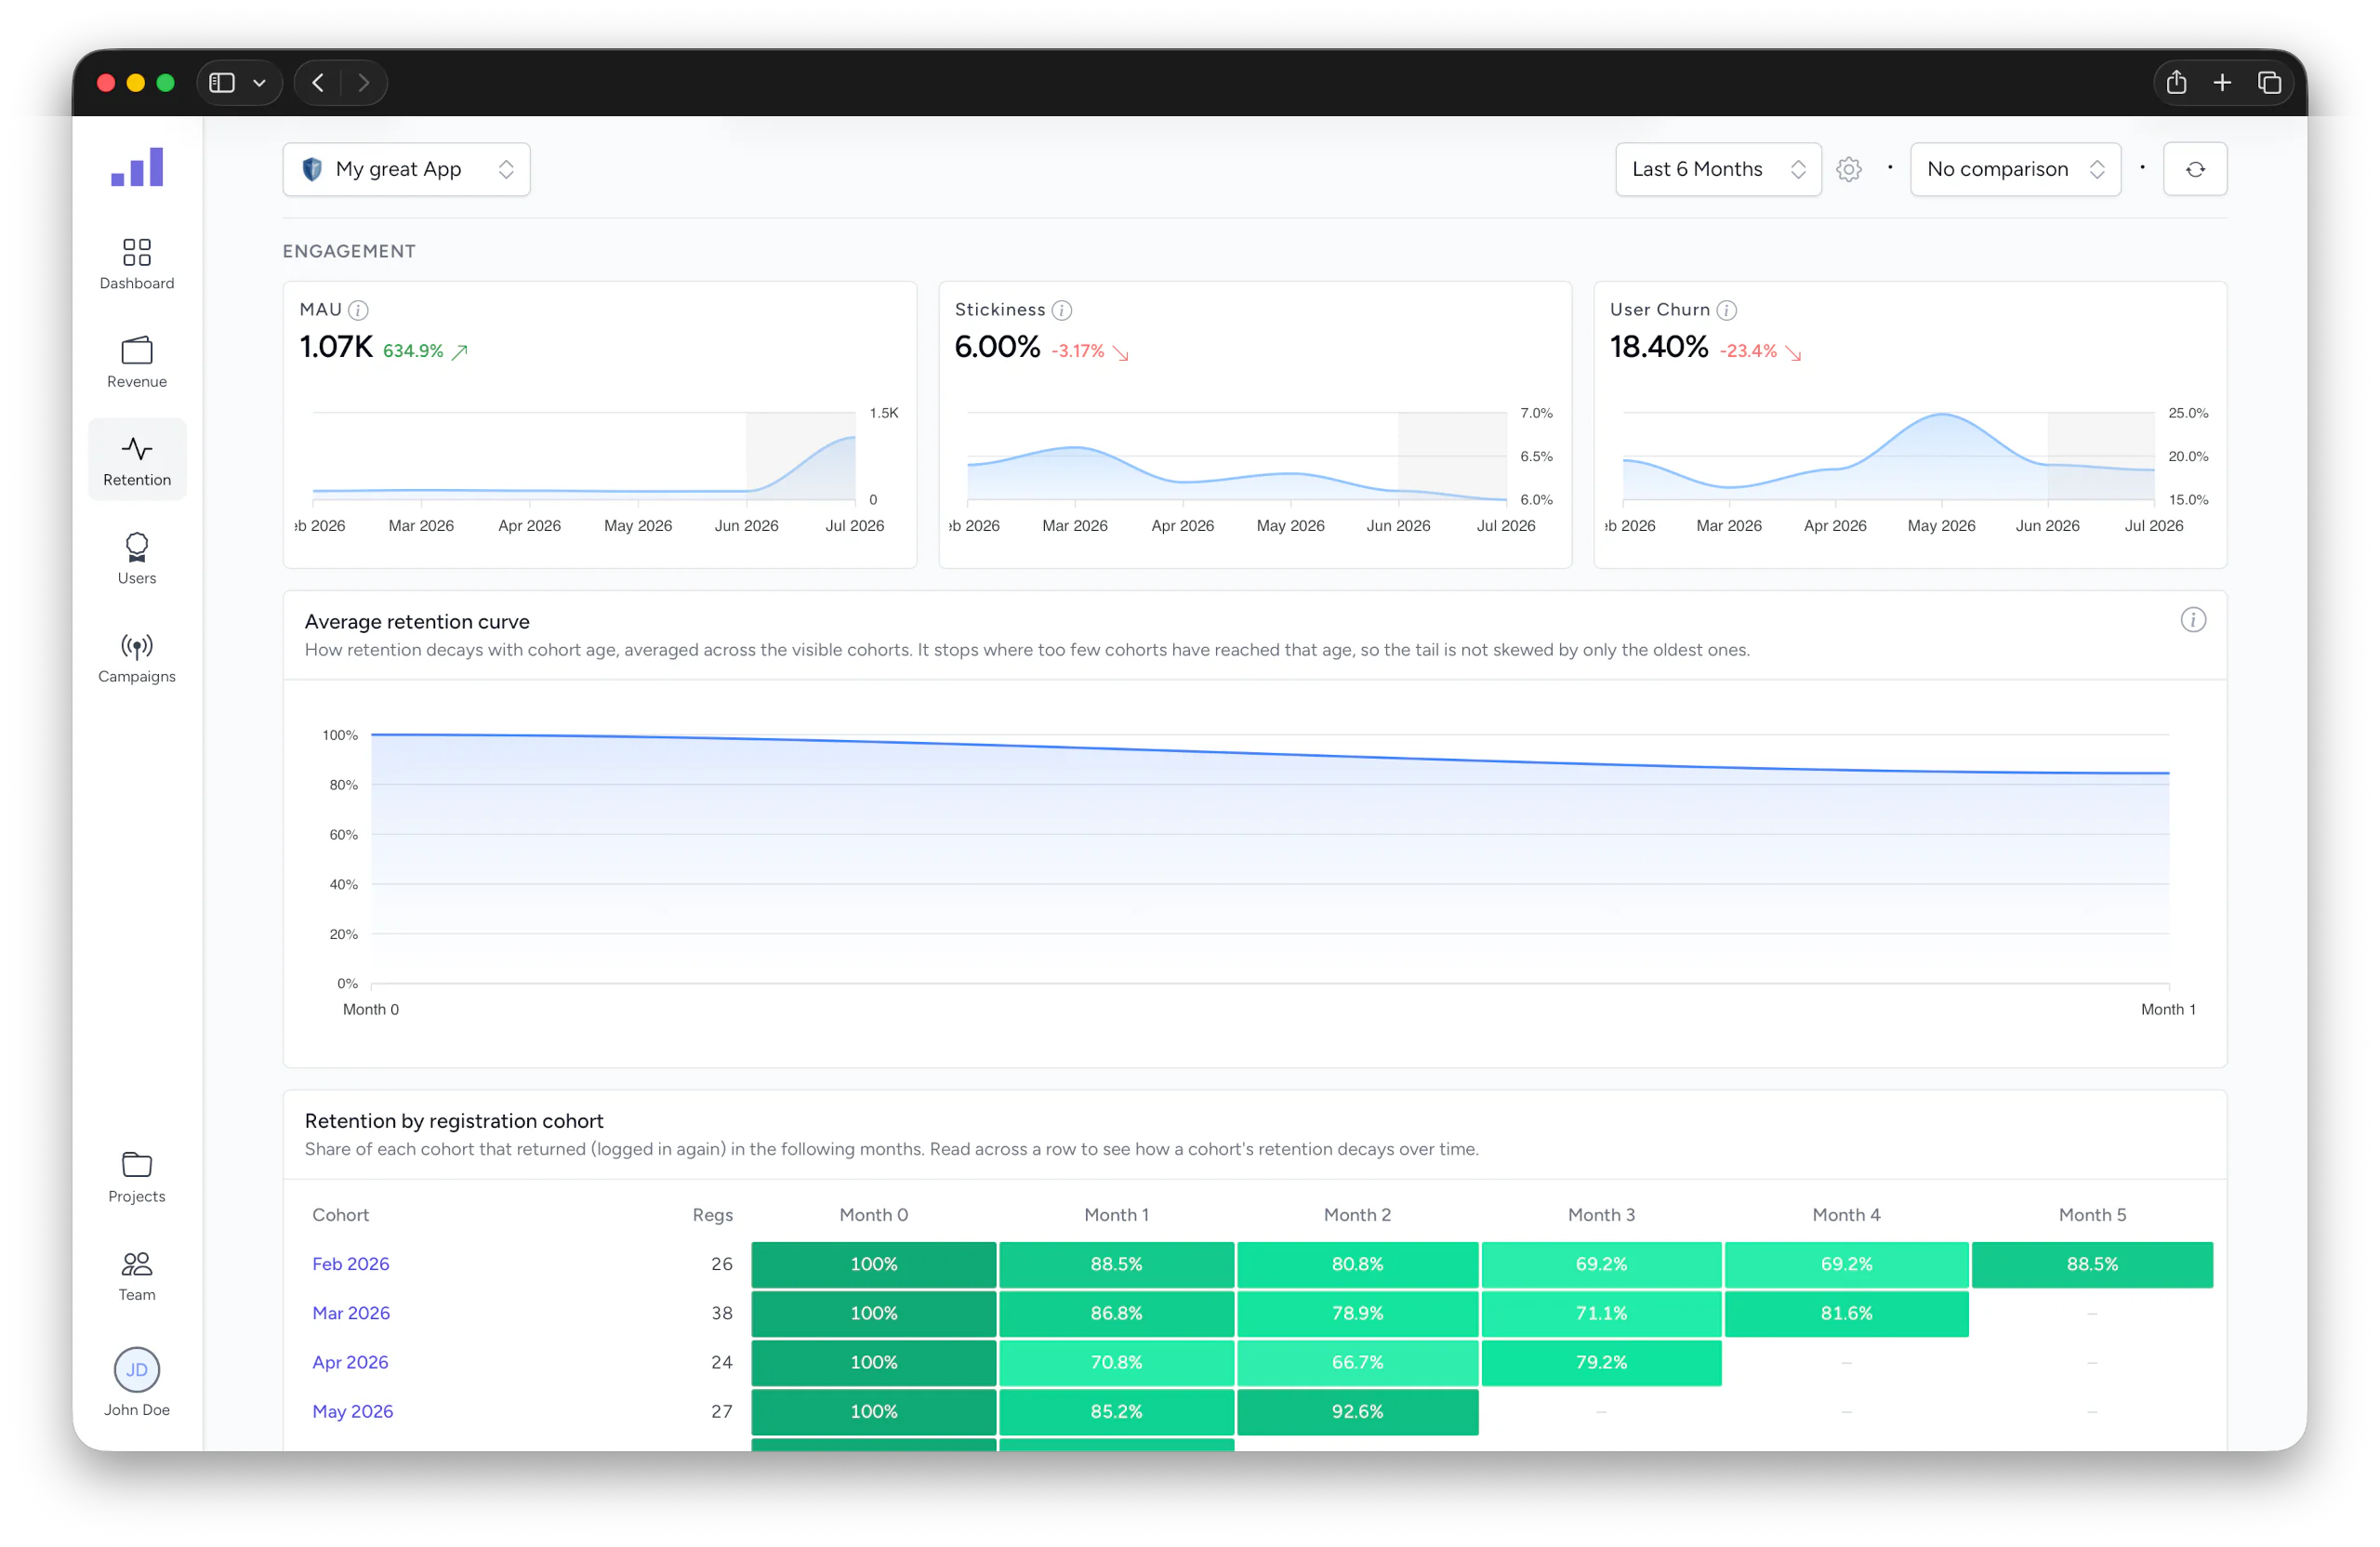
On top of all that: cohort retention you can filter by channel, so the question shifts from "do users come back?" to "which channel brings the users who come back?", plus stickiness and user churn. More in Laravel Retention Analytics.
The Question the Stack Can Finally Answer
Put those layers on top of the same connected chain and a question that used to need a quarter-end spreadsheet becomes a filter click:
Of the customers our newsletter brought in, what's their MRR, how many are still active after 90 days, and did the campaign turn a profit after ad spend?
Traffic tool alone can't answer it. Revenue tool alone can't. The pixel definitely can't. The combined stack can, because it was one dataset the whole time.
That's the real pitch. Not "three tools in one" as a bundle, but three tools in one as a join that the separate tools can never perform. A filter click instead of a spreadsheet.
Or, as of recently: literally a question you type.
Ask the Stack a Question. Literally.
SimpleStats now ships an AI assistant built into the dashboard. You ask the question from above the way you'd ask a colleague:
- "Which channel brought the customers who are still active after 90 days?"
- "What's the MRR of everyone who came in through the newsletter?"
- "Did the spring campaign turn a profit after ad spend?"
The assistant runs real queries against your analytics and answers with your actual numbers. Every figure comes from a query result, never from an estimate, and it always states which date range and project it refers to.
It's worth pausing on why this works, because it's the same join argument one more time: an AI assistant is only as good as the dataset it can query. Put a chatbot on top of the three-tool stack and it inherits the three-tool problem, three IDs and no join, so the interesting questions stay unanswerable no matter how smart the model is. One connected dataset is the quiet prerequisite for AI on your analytics being more than a demo.
And because these questions increasingly come up while you're coding, SimpleStats also ships a hosted MCP server. Connect it to Claude Code with one command:
claude mcp add --transport http simplestats https://simplestats.io/mcp \
--header "Authorization: Bearer API_TOKEN_HERE"
"Did Tuesday's deploy change conversion?" is now a question for your editor, answered from the same connected data. Cursor and Claude Desktop work too; setup details are in the MCP server docs.
Setting It Up
There's no three-way integration to wire together, because there aren't three tools. You install one Composer package in your Laravel app:
composer require simplestats-io/laravel-client
It captures visitors on incoming requests, and you point it at your existing User and payment models to track registrations, logins and payments. From there the whole stack (traffic, subscriptions, campaign profit, retention, and the AI assistant on top) fills in from the same data, server-side. The payment-tracking guide covers the Stripe, Paddle and Lemon Squeezy setup in a few minutes.
Use your ad platforms for buying ads and your billing provider for taking money. For understanding whether any of it actually works, one connected, server-side stack beats three disconnected dashboards every time.
Ready to see your own numbers connected? Start with SimpleStats, install the package, and your first visitors show up in minutes.
SimpleStats is a server-side analytics platform built specifically for Laravel. It tracks visitors, registrations, logins, and payments, all GDPR-compliant, all unaffected by ad blockers, all connected through UTM attribution. Set it up in minutes with a single Composer package.
0 Comments
Log in to join the conversation.No comments yet. Be the first to share your thoughts.