
Bitcoin’s calm is back and so is the setup for a volatility explosion
Bitcoin’s daily price swings have tightened to their narrowest since January, making clean trades harder to find. Here's what could happen next.
- Bitcoin trading has entered one of its quietest stretches since January, with prices largely stuck between $62,000 and $65,000.
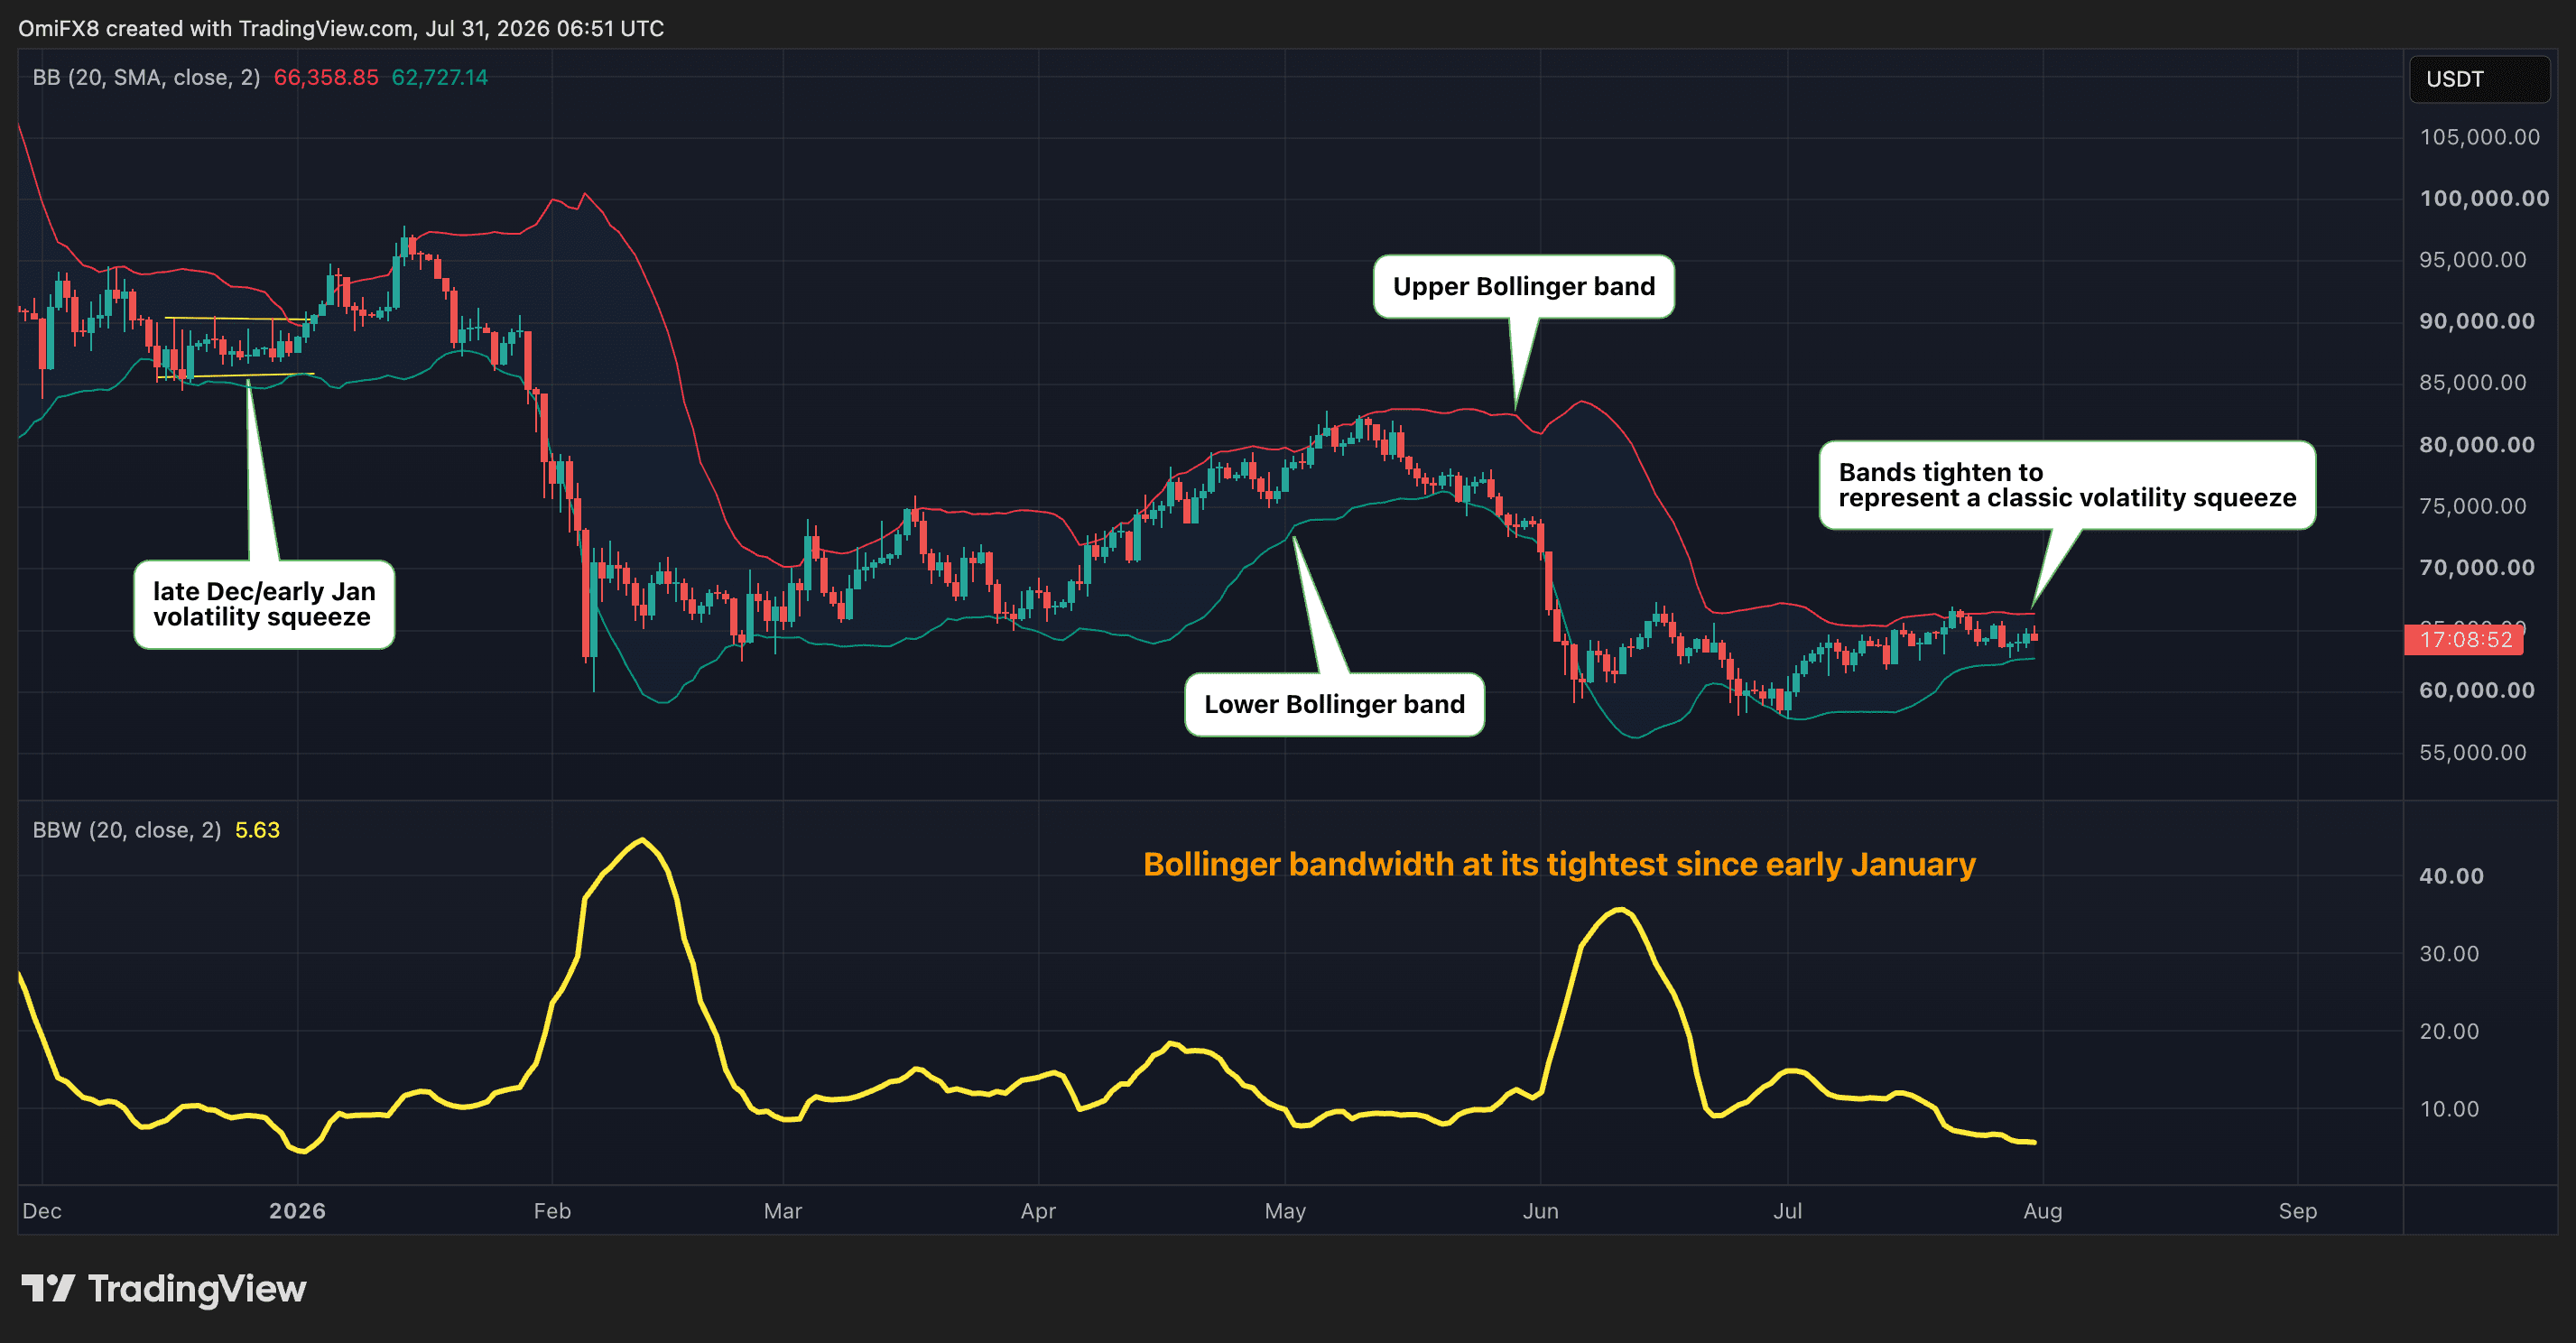
- Bollinger bandwidth on bitcoin’s daily price chart has tightened to the narrowest since the start of the year, signaling a significant squeeze in volatility.
- Such prolonged periods of tight trading ranges have historically preceded sharp moves in bitcoin’s price, though the direction of the next big move is uncertain.
Trading bitcoin BTC$64,171.64 these days feels much as it did seven months ago, at the start of the year.
The price of the largest cryptocurrency is stuck in a tight range, with volatility at six-month lows, and traders are struggling to identify a break to bet on. Not surprisingly, transaction volume has slumped and is on track for the lowest since November 2023.
Back in January, the bitcoin price had been stuck in a narrow band, $86,000-$90,000, since the second half of December. Trading volume had dropped to an average of $5.1 billion a day, and has fallen to $2.2 billion this month, according to research from K33.
What happened next is interesting. Volatility picked up in the following weeks, the price rose to nearly $98,000 by mid-January and then slid down to around $60,000 by early February. Trading volume rose.
And that’s precisely the point. Volatility is cyclical: long stretches of quiet price action often precede a sharp move in one direction or the other. Like a coiled spring, the tighter the market compresses, the more forcefully it can unwind.
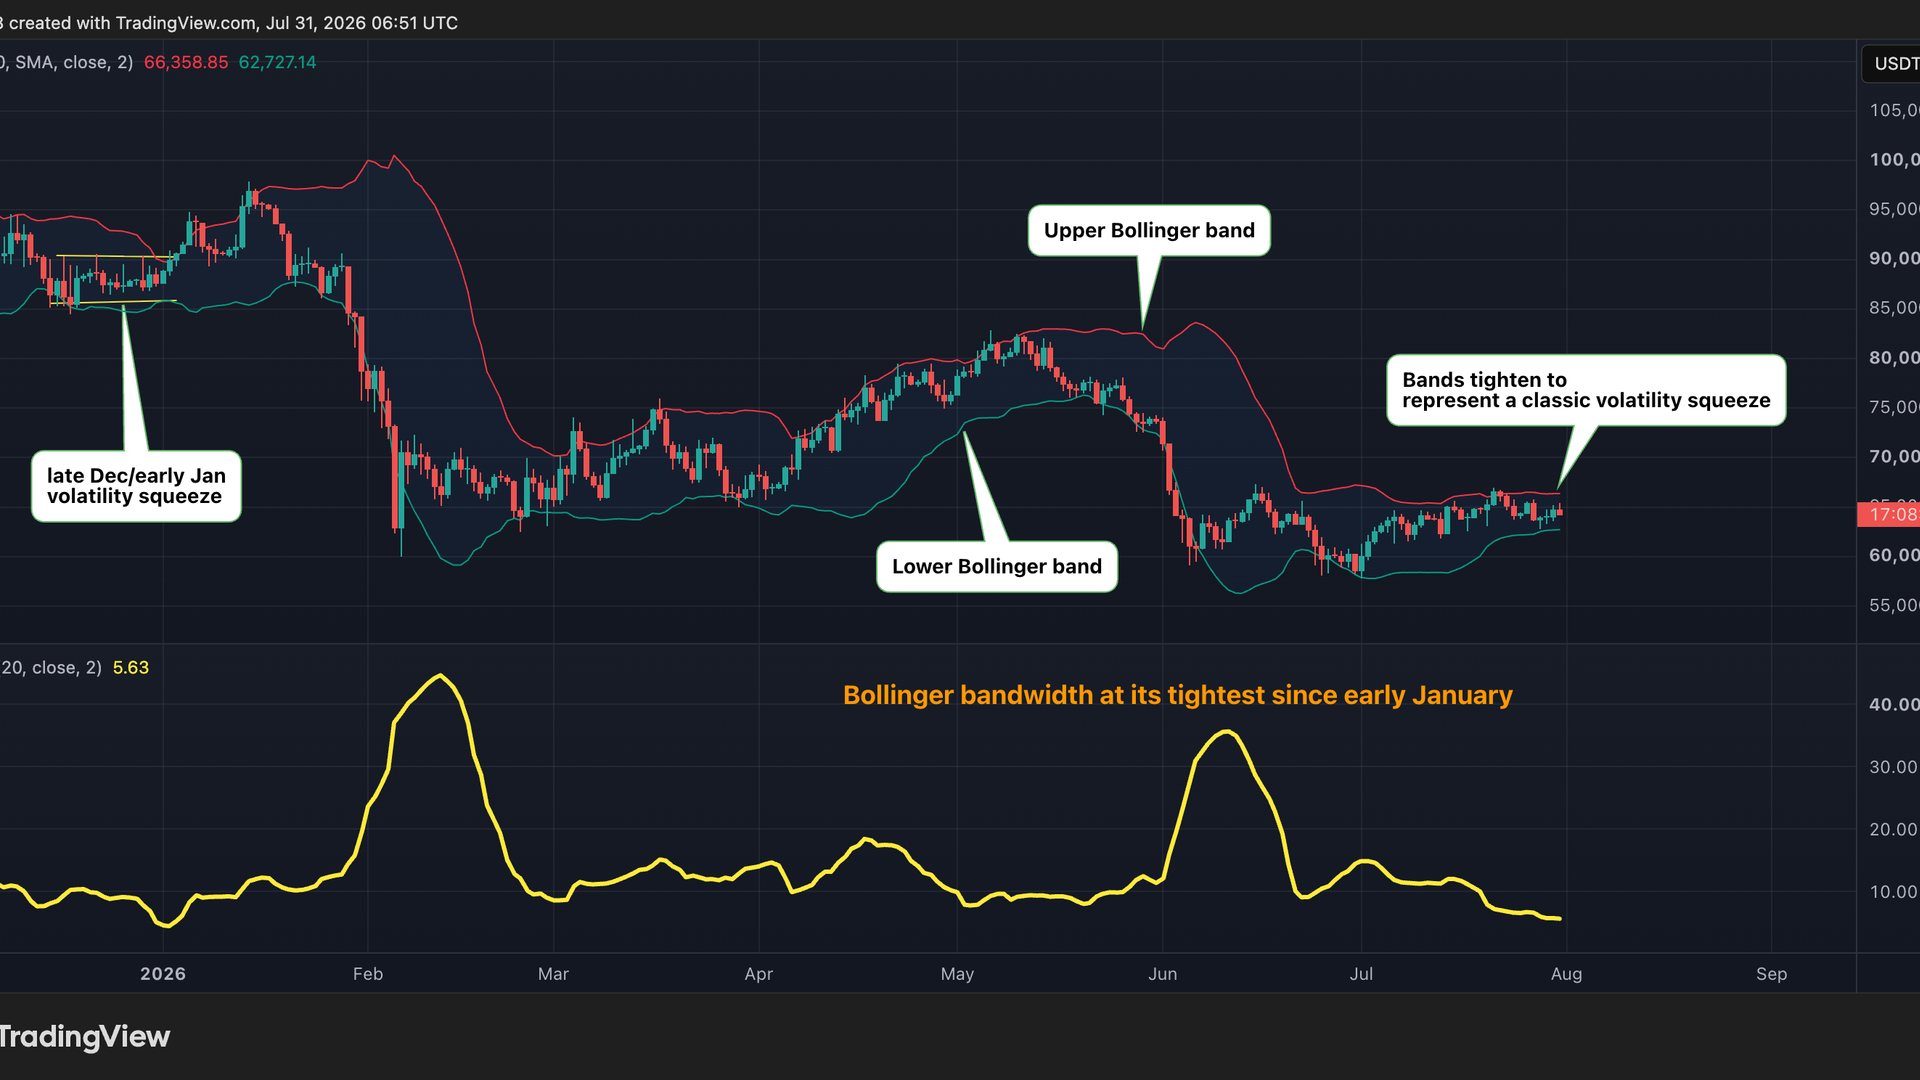
To see what that looks like, consider bitcoin’s Bollinger bands on the chart above. These are lines drawn at two standard deviations above and below the cryptocurrency’s price. They measure the extent of the price’s daily swing, its volatility, and the gap between them is now at the narrowest since January.
When Bollinger bands get this tight, momentum trades dry up and range traders have to settle for tiny price moves. For anyone who thrives on bigger swings, the market is simply refusing to cooperate. The Bollinger bandwidth indicator in the lower pane has dropped to 5.66 points.
BTC’s price action has largely mirrored this cyclical volatility pattern since at least 2018.
While the timing can’t be assured, the current squeeze is likely to be followed by a decisive move. Direction is never guaranteed, meaning the break could go either way, but the calm itself tends to be temporary. The longer the lull persists, the more forceful the eventual breakout could be.
Anvil: The Missing Collateral Layer

Anvil: The Missing Collateral Layer
Anvil is a shared on-chain collateral layer built on a programmable letter of credit: reserve assets as a guarantee -no loan, no interest, keep custody & yield.
Anvil is a shared on-chain collateral layer built on a programmable letter of credit: reserve assets as a guarantee -no loan, no interest, keep custody & yield.
Why it matters:
Anvil is a shared on-chain collateral layer built on a programmable letter of credit: reserve assets as a guarantee -no loan, no interest, keep custody & yield.
0 Comments
Log in to join the conversation.No comments yet. Be the first to share your thoughts.