
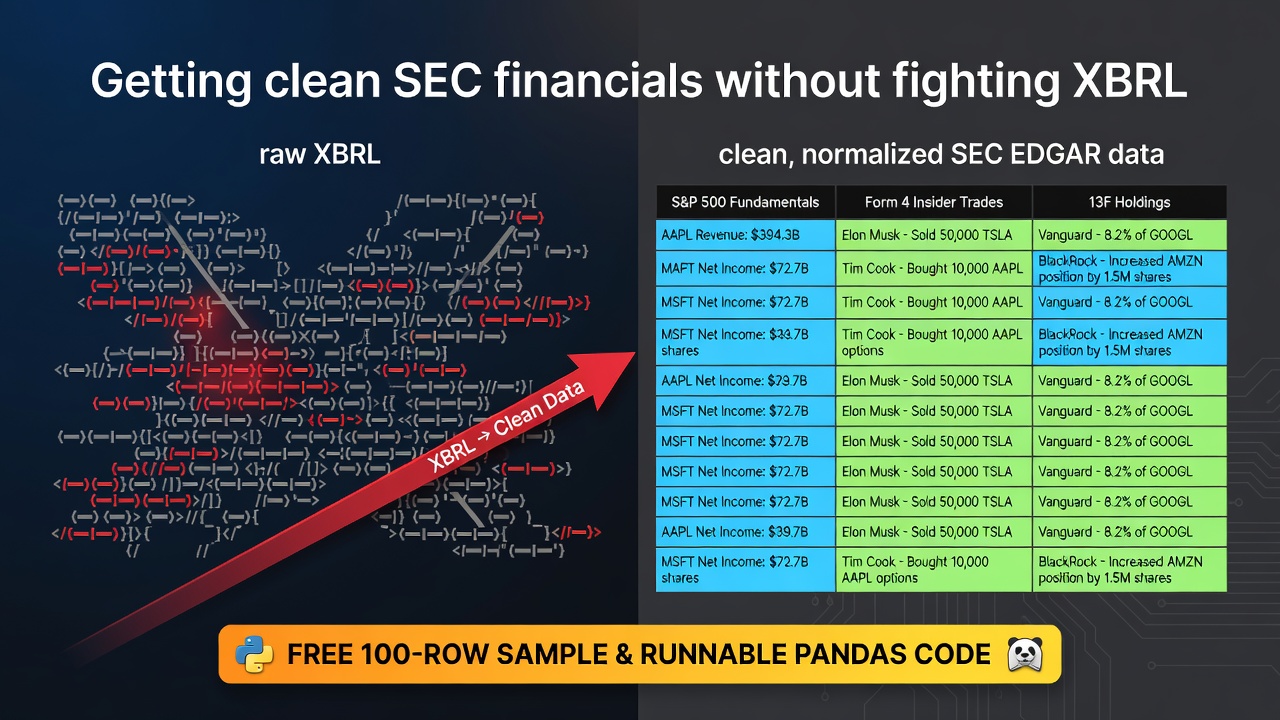

If you've ever tried to pull financial data directly from SEC EDGAR, you already know the problem. The XBRL filings are technically structured, but in practice they're a mess: inconsistent concept names across filers, dimensional context you have to decode, unit scaling that varies filing-to-filing, and amendments that quietly supersede earlier numbers. You can spend a weekend on a parser and still not be confident the figures line up.
This post walks through what clean, normalized SEC data looks like — using a free 100-row sample you can download right now without signing up for anything.
What the raw XBRL problem actually looks like
The SEC's XBRL taxonomy has thousands of concepts, and filers can extend it with custom tags. One company reports gross profit as us-gaap:GrossProfit. Another computes it inline and never emits that tag. A third uses a custom extension. Normalizing across ~480 large-caps means either writing a pile of tag-fallback rules or accepting holes.
Then there's dimensional context. A segment income statement is a different XBRL context from the consolidated figure — same tag, same period, different context id. Filter context wrong and you double-count revenue or keep a segment while dropping the consolidated row.
Unit scaling is another trap. Some filers report in dollars, some in thousands, some in millions. The instance document declares the scale, but if your parser doesn't apply it, two companies' revenue end up three orders of magnitude apart for no visible reason.
None of this is secret knowledge — it's just tedious, and it's the same tedium every analyst rebuilds from scratch.
What normalized looks like
I ran the S&P 500's EDGAR filings through a normalization pipeline (Filingrail) and packaged the result as a flat CSV. It's one row per (company, statement_type, period) — income-statement, balance-sheet, and cash-flow rows are separate rows keyed by statement_type, each with the metrics for that statement filled in and the others blank. Every figure is in one currency (USD), and every row carries accession_number and filing_url so you can open the exact filing a number came from.
The free 100-row sample is at secdata.hudsonenterprisesllc.com — direct download, no signup.
Schema (abbreviated — the fundamentals pack):
| Column | Type | Notes |
|---|---|---|
ticker / company_name / cik
|
str | Issuer identity |
statement_type |
str |
income_statement, balance_sheet, cash_flow
|
period_type |
str |
annual, quarterly, ytd
|
period_start / period_end
|
date | Reporting period |
form_type / filing_date
|
str/date | e.g. 10-K, 10-Q
|
revenue, net_income, operating_income, eps_diluted, … |
float | Income-statement metrics (USD) |
total_assets, stockholders_equity, long_term_debt, … |
float | Balance-sheet metrics (USD) |
operating_cash_flow, capex, dividends_paid, … |
float | Cash-flow metrics (USD) |
accession_number / filing_url
|
str | Ties back to the EDGAR filing |
A worked example with the free sample
Download sp500-fundamentals_2026-07-07_sample.csv from the landing page — 100 rows drawn from the full 380,946-row pack. Margins live entirely on the income-statement rows, so they're the cleanest thing to compute without a cross-statement join:
import pandas as pd

df = pd.read_csv("sp500-fundamentals_2026-07-07_sample.csv")

inc = df[df["statement_type"] == "income_statement"].copy()
inc["operating_margin"] = inc["operating_income"] / inc["revenue"]
inc["net_margin"]       = inc["net_income"]       / inc["revenue"]

print(
    inc[["ticker", "period_end", "period_type", "revenue",
         "operating_margin", "net_margin"]]
    .dropna(subset=["net_margin"])
    .sort_values("net_margin", ascending=False)
    .head(10)
    .to_string(index=False)
)
Enter fullscreen mode Exit fullscreen mode
Because each statement_type is its own row, a ratio that spans statements — return on equity, say — is a self-join on the period:
inc = df[df["statement_type"] == "income_statement"][
    ["ticker", "period_end", "period_type", "net_income"]]
bal = df[df["statement_type"] == "balance_sheet"][
    ["ticker", "period_end", "period_type", "stockholders_equity"]]

roe = inc.merge(bal, on=["ticker", "period_end", "period_type"])
roe["roe"] = roe["net_income"] / roe["stockholders_equity"]
print(roe.dropna(subset=["roe"]).sort_values("roe", ascending=False).head(10)
        .to_string(index=False))
Enter fullscreen mode Exit fullscreen mode
(The 100-row sample is a thin slice, so the join is sparse — it fills out on the full pack.) Since every row keeps its filing_date and accession_number, if you ever see an original and an amended figure for the same period you can resolve it yourself with sort_values("filing_date").drop_duplicates([...], keep="last") and know exactly which filing won.
The insider-trades pack is a flat transaction table — the ticker column is issuer_ticker, and the SEC Form 4 code is transaction_code:
insider = pd.read_csv("insider-trades-form4_2026-07-07_sample.csv")

acquire = {"P", "A", "M"}   # purchase, grant/award, option exercise
dispose = {"S", "F"}        # sale, tax withholding

insider["signed_shares"] = insider.apply(
    lambda r: r["shares"] if r["transaction_code"] in acquire
    else -r["shares"] if r["transaction_code"] in dispose
    else 0.0,
    axis=1,
)

net = (insider.groupby("issuer_ticker")["signed_shares"].sum()
       .rename("net_insider_shares").reset_index())
print(net.sort_values("net_insider_shares").to_string(index=False))
Enter fullscreen mode Exit fullscreen mode
This is the kind of thing that takes a day against raw EDGAR feeds and about ten minutes when the data is already clean and consistently keyed.
The paid pack and what else is available
The full S&P 500 Fundamentals pack is 380,946 rows across 481 companies for $19 as a one-time download — with the data dictionary, a runnable Jupyter notebook, and a MANIFEST of SHA-256 checksums and the extract date. Two more at secdata.hudsonenterprisesllc.com: Insider Trades (Form 4) (80,700 transactions, Parquet, $29) and 13F Holdings 2026-Q1 (222,012 institutional positions, Parquet, $29).
All three are point-in-time snapshots dated 2026-07-07 — the date is in every filename, so it's reproducible and citable rather than silently going stale. If you'd rather have it refreshed daily than as a one-time download, the Filingrail API serves the same data live.
Source: SEC EDGAR (U.S. government, public domain). Descriptive historical data — not investment advice.
0 Comments
Log in to join the conversation.No comments yet. Be the first to share your thoughts.