
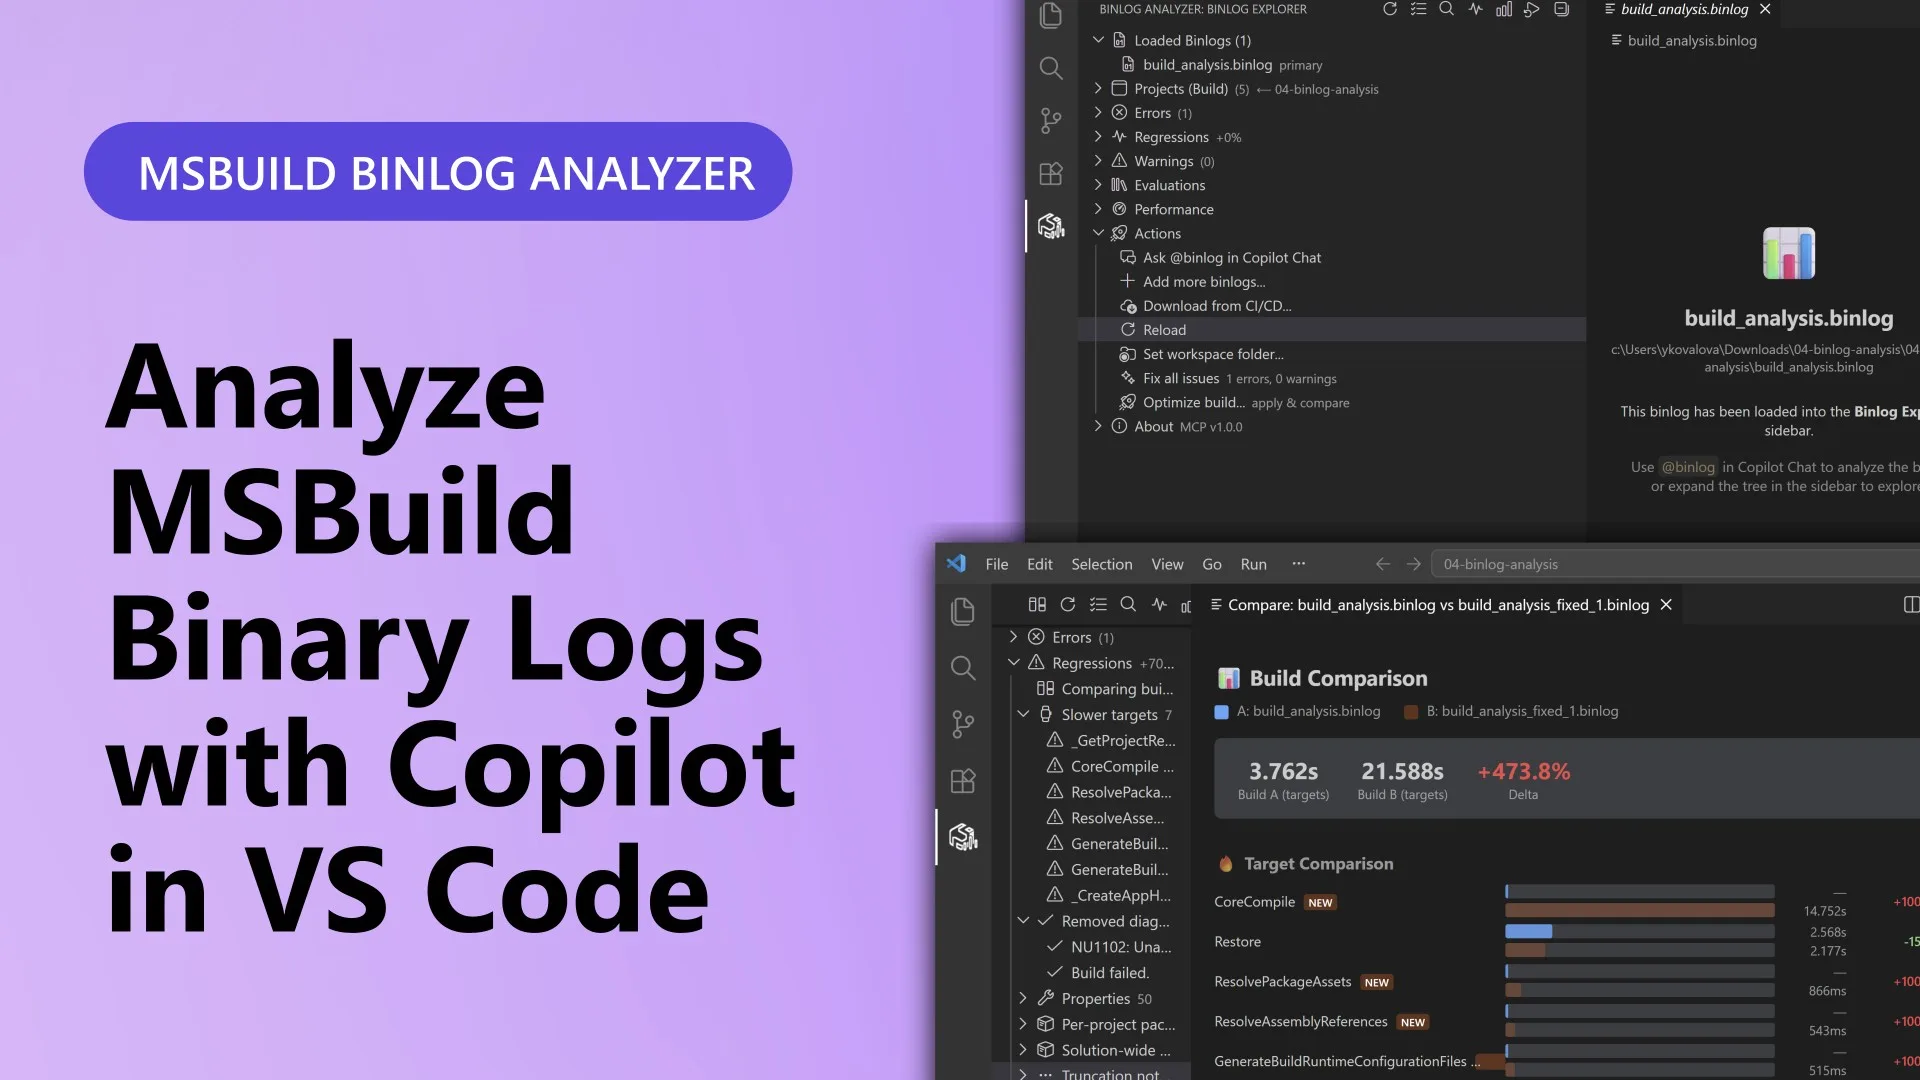
You know the moment. CI goes red, or a build that took 8 seconds yesterday now
takes 40, and you’re staring at a wall of MSBuild output trying to find the one
line that matters. The answer is almost always sitting in the binary log
(.binlog) – it records every project, target, task, property, and diagnostic
in the build. The problem is that reading one has meant firing up a separate
viewer and already knowing where to look.
What if you could just ask?
That’s the idea behind the MSBuild Binlog Analyzer for VS Code, now in Preview on the Visual Studio Marketplace. It brings binlog analysis right into your editor and hands the tedious detective work to GitHub Copilot Chat – so you can stay in the flow and keep shipping.
Just want an agent to investigate builds for you – say, unattended in CI? Check out the Microsoft Binlog MCP Server – the same analysis engine, driven headlessly. This post is about the interactive, in-editor experience.
The problems it solves
Build logs are the best evidence you have and the most annoying to read. The Binlog Analyzer turns that evidence into answers:
- “Why did my build fail?” Get a plain-language root cause instead of scrolling NuGet restore noise – and fix it with a single click, right in VS Code.
- “Why is this slow?” See the slowest targets and tasks ranked, with the critical path that actually gates your build time highlighted for you.
- “What changed?” Compare two builds side by side and get an itemized diff of timing, diagnostics, properties, and package versions – so “it feels slower” becomes “CoreCompile regressed by 14.7s.”
- “Is my incremental build working?” Find out which targets rebuilt and why, instead of guessing.
No context-switching, no separate tool, no decoding MSBuild by hand.
What it is
Under the hood, the extension pairs with a .NET global-tool MCP server, Microsoft.AITools.BinlogMcp, which exposes dozens of build-analysis tools over the Model Context Protocol. Copilot calls those tools to ground its answers in your actual log – not guesswork. Best of all, the server is auto-installed on first use, so there’s nothing to wire up by hand.
Install
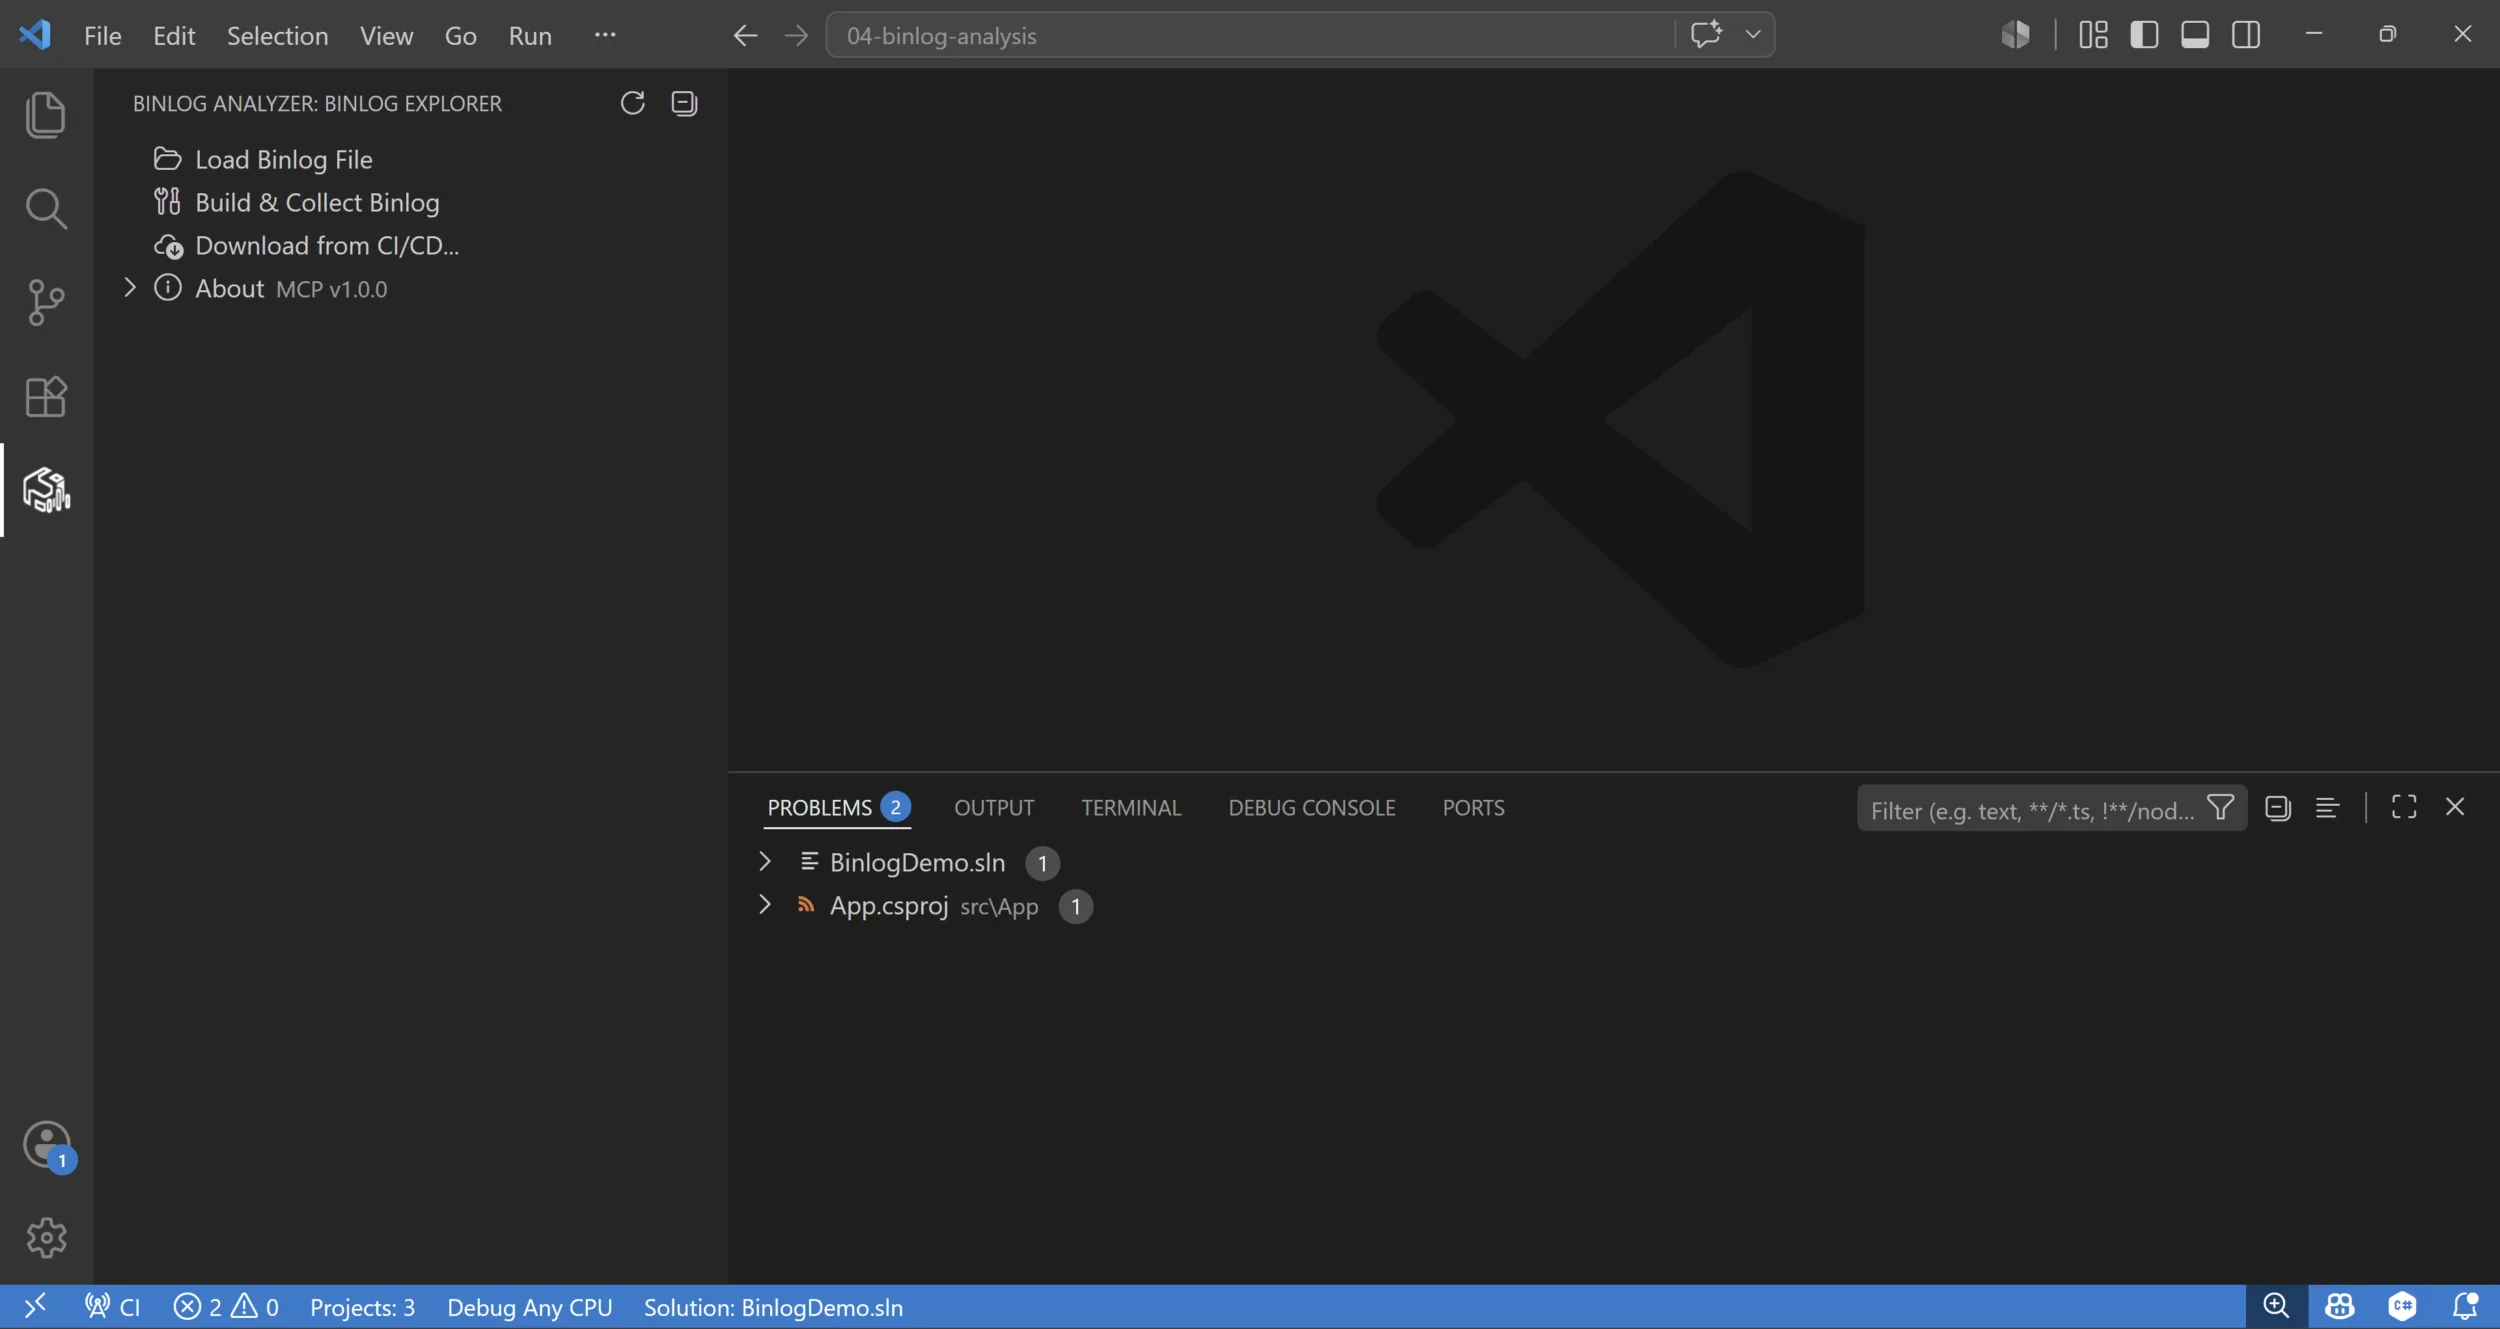
- Install the extension from the Marketplace. You’ll need VS Code 1.99+, GitHub Copilot, and the .NET SDK.
- Open a
.binlogin one of three ways: Binlog: Load File from the Command Palette (Ctrl+Shift+P), Build & Collect Binlog to build and capture in one step, or Open in VS Code from the Structured Log Viewer. - Ask
@binlogin Copilot Chat:
@binlog why did the build fail?
@binlog what are the slowest targets?
@binlog /perf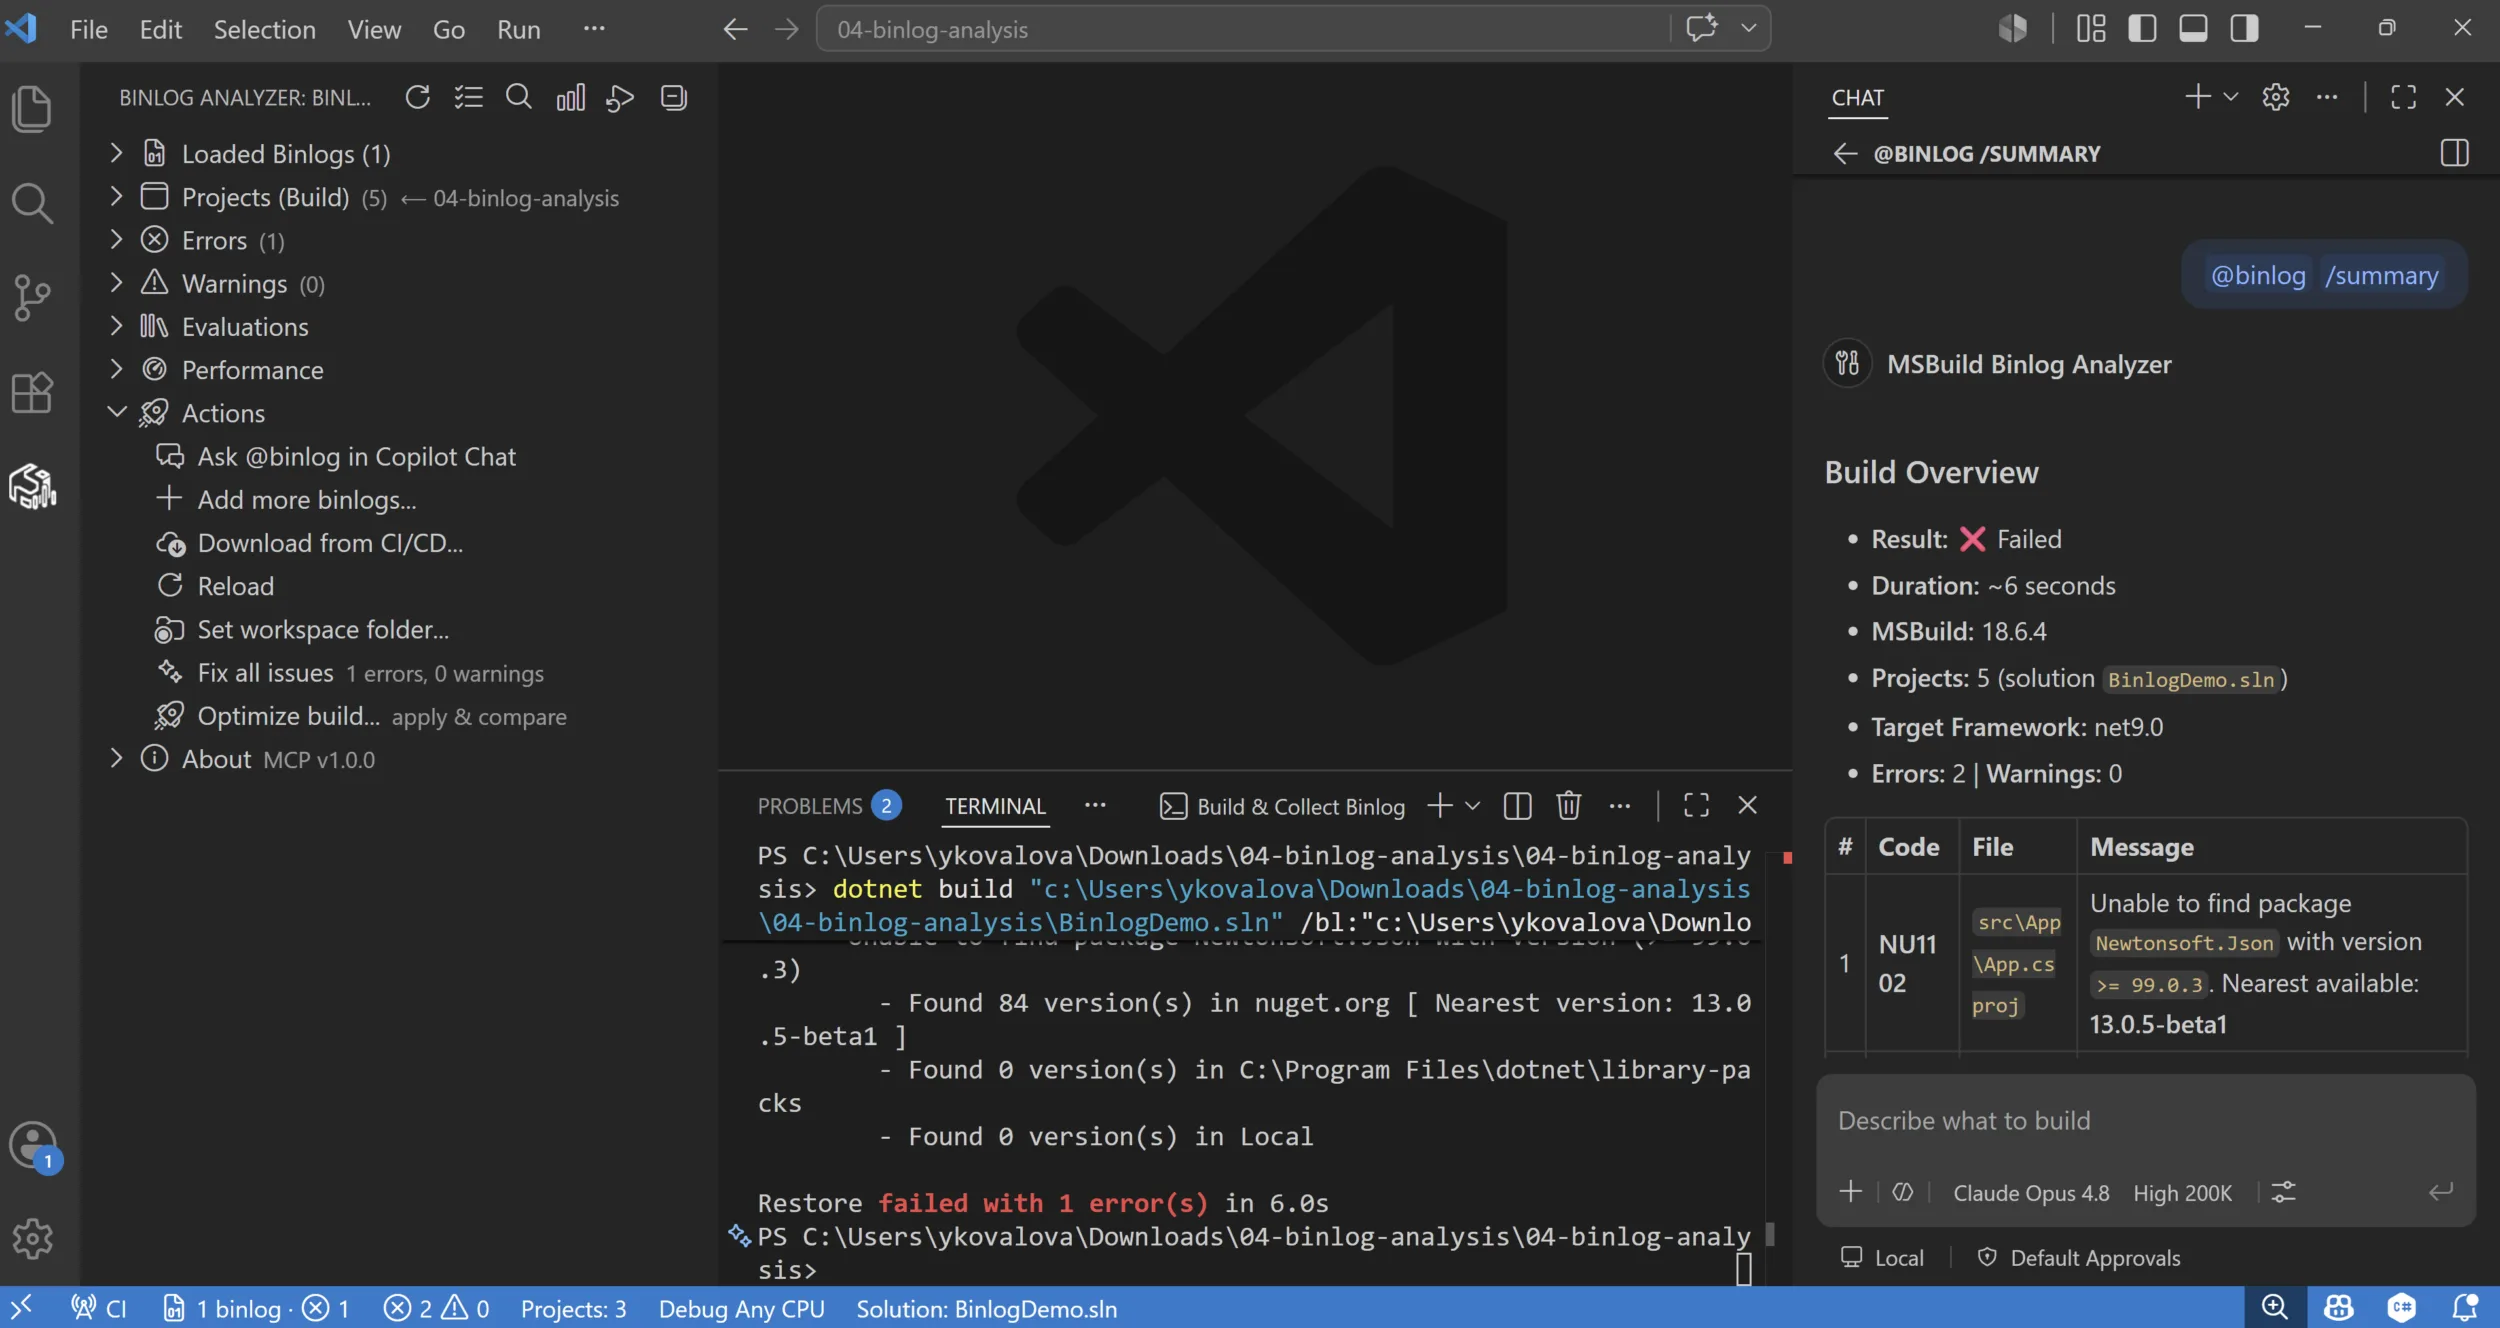
A tour of the best parts
The Binlog Explorer is your map
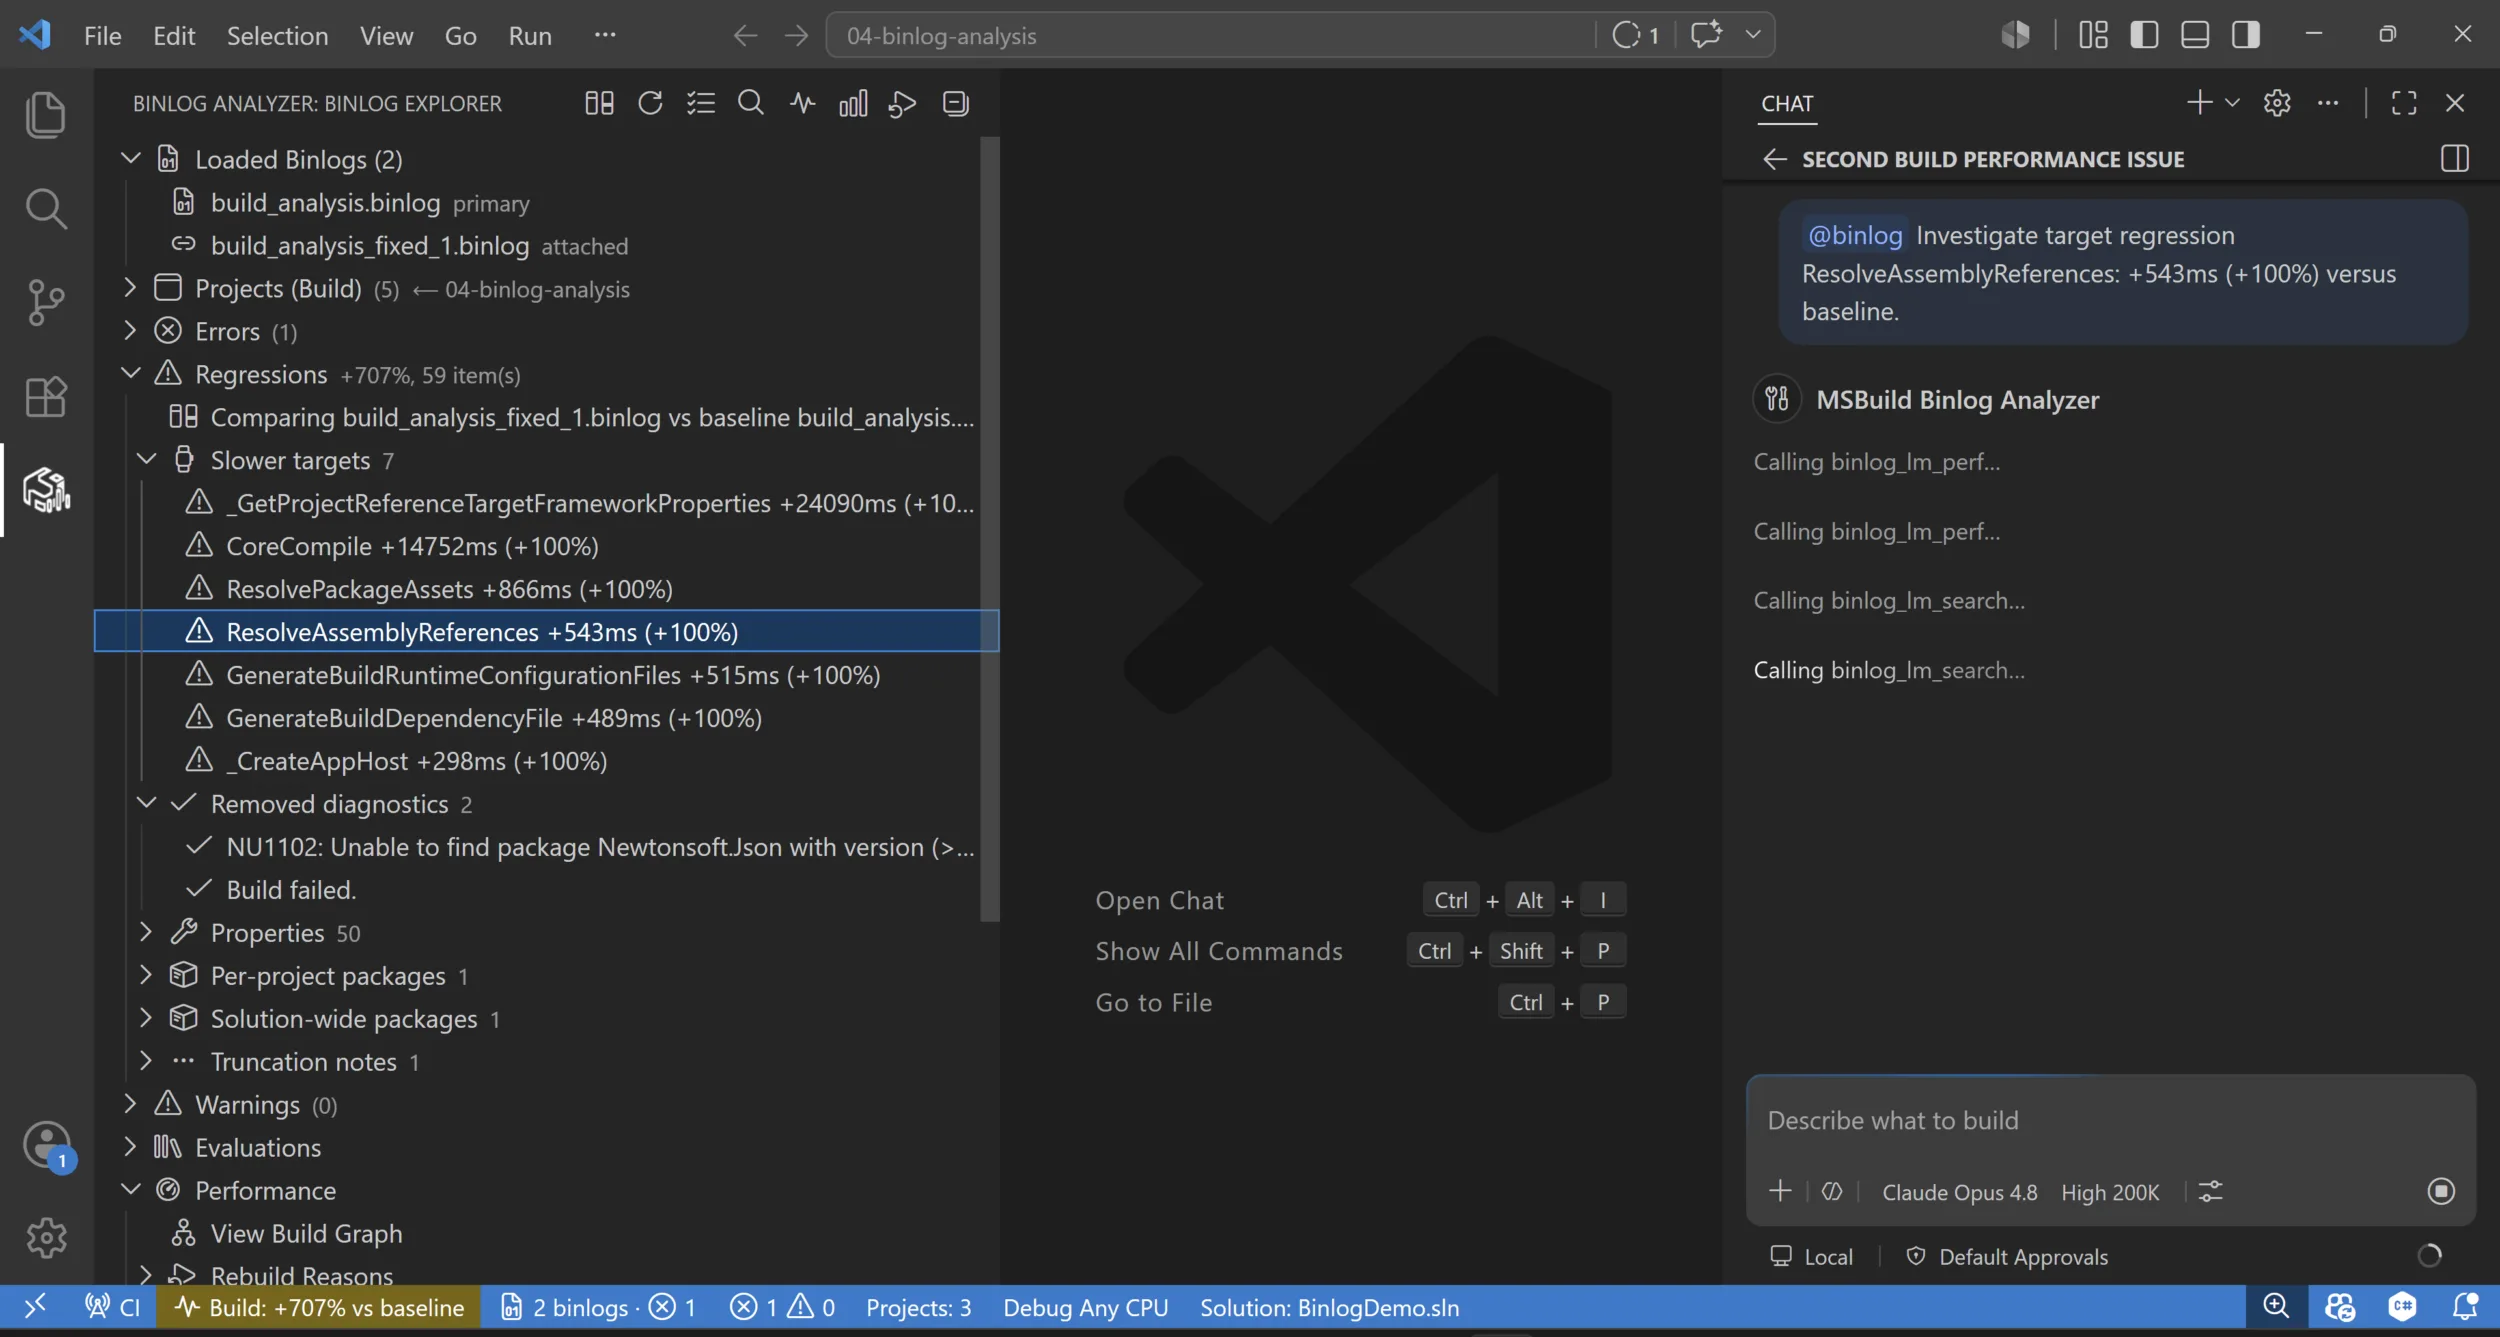
The sidebar tree lays the whole build out at a glance: Loaded Binlogs, Projects, Errors, Warnings, and a Performance section with the slowest targets, slowest tasks, rebuild reasons, and analyzer timing. Diagnostics also light up VS Code’s native Problems panel with per-project CodeLens and an Ask @binlog action – so an error in the tree is one click from an explanation.
@binlog chat – and fixing the build in one click
This is where analysis becomes a conversation. Ask open-ended questions, or
reach for slash commands like /errors, /perf, /timeline, /compare,
/summary, /incremental, and /buildcheck. Because the participant calls the
MCP tools directly, every answer cites real data from the log.
Then comes the part people love: Fix all issues. Copilot reads the failing project, applies the fix, rebuilds, and loads the before/after binlogs so you can confirm it worked – all without leaving the editor. Prefer to go one at a time? Right-click any diagnostic and choose Auto-fix with Copilot.
Catch regressions before they ship
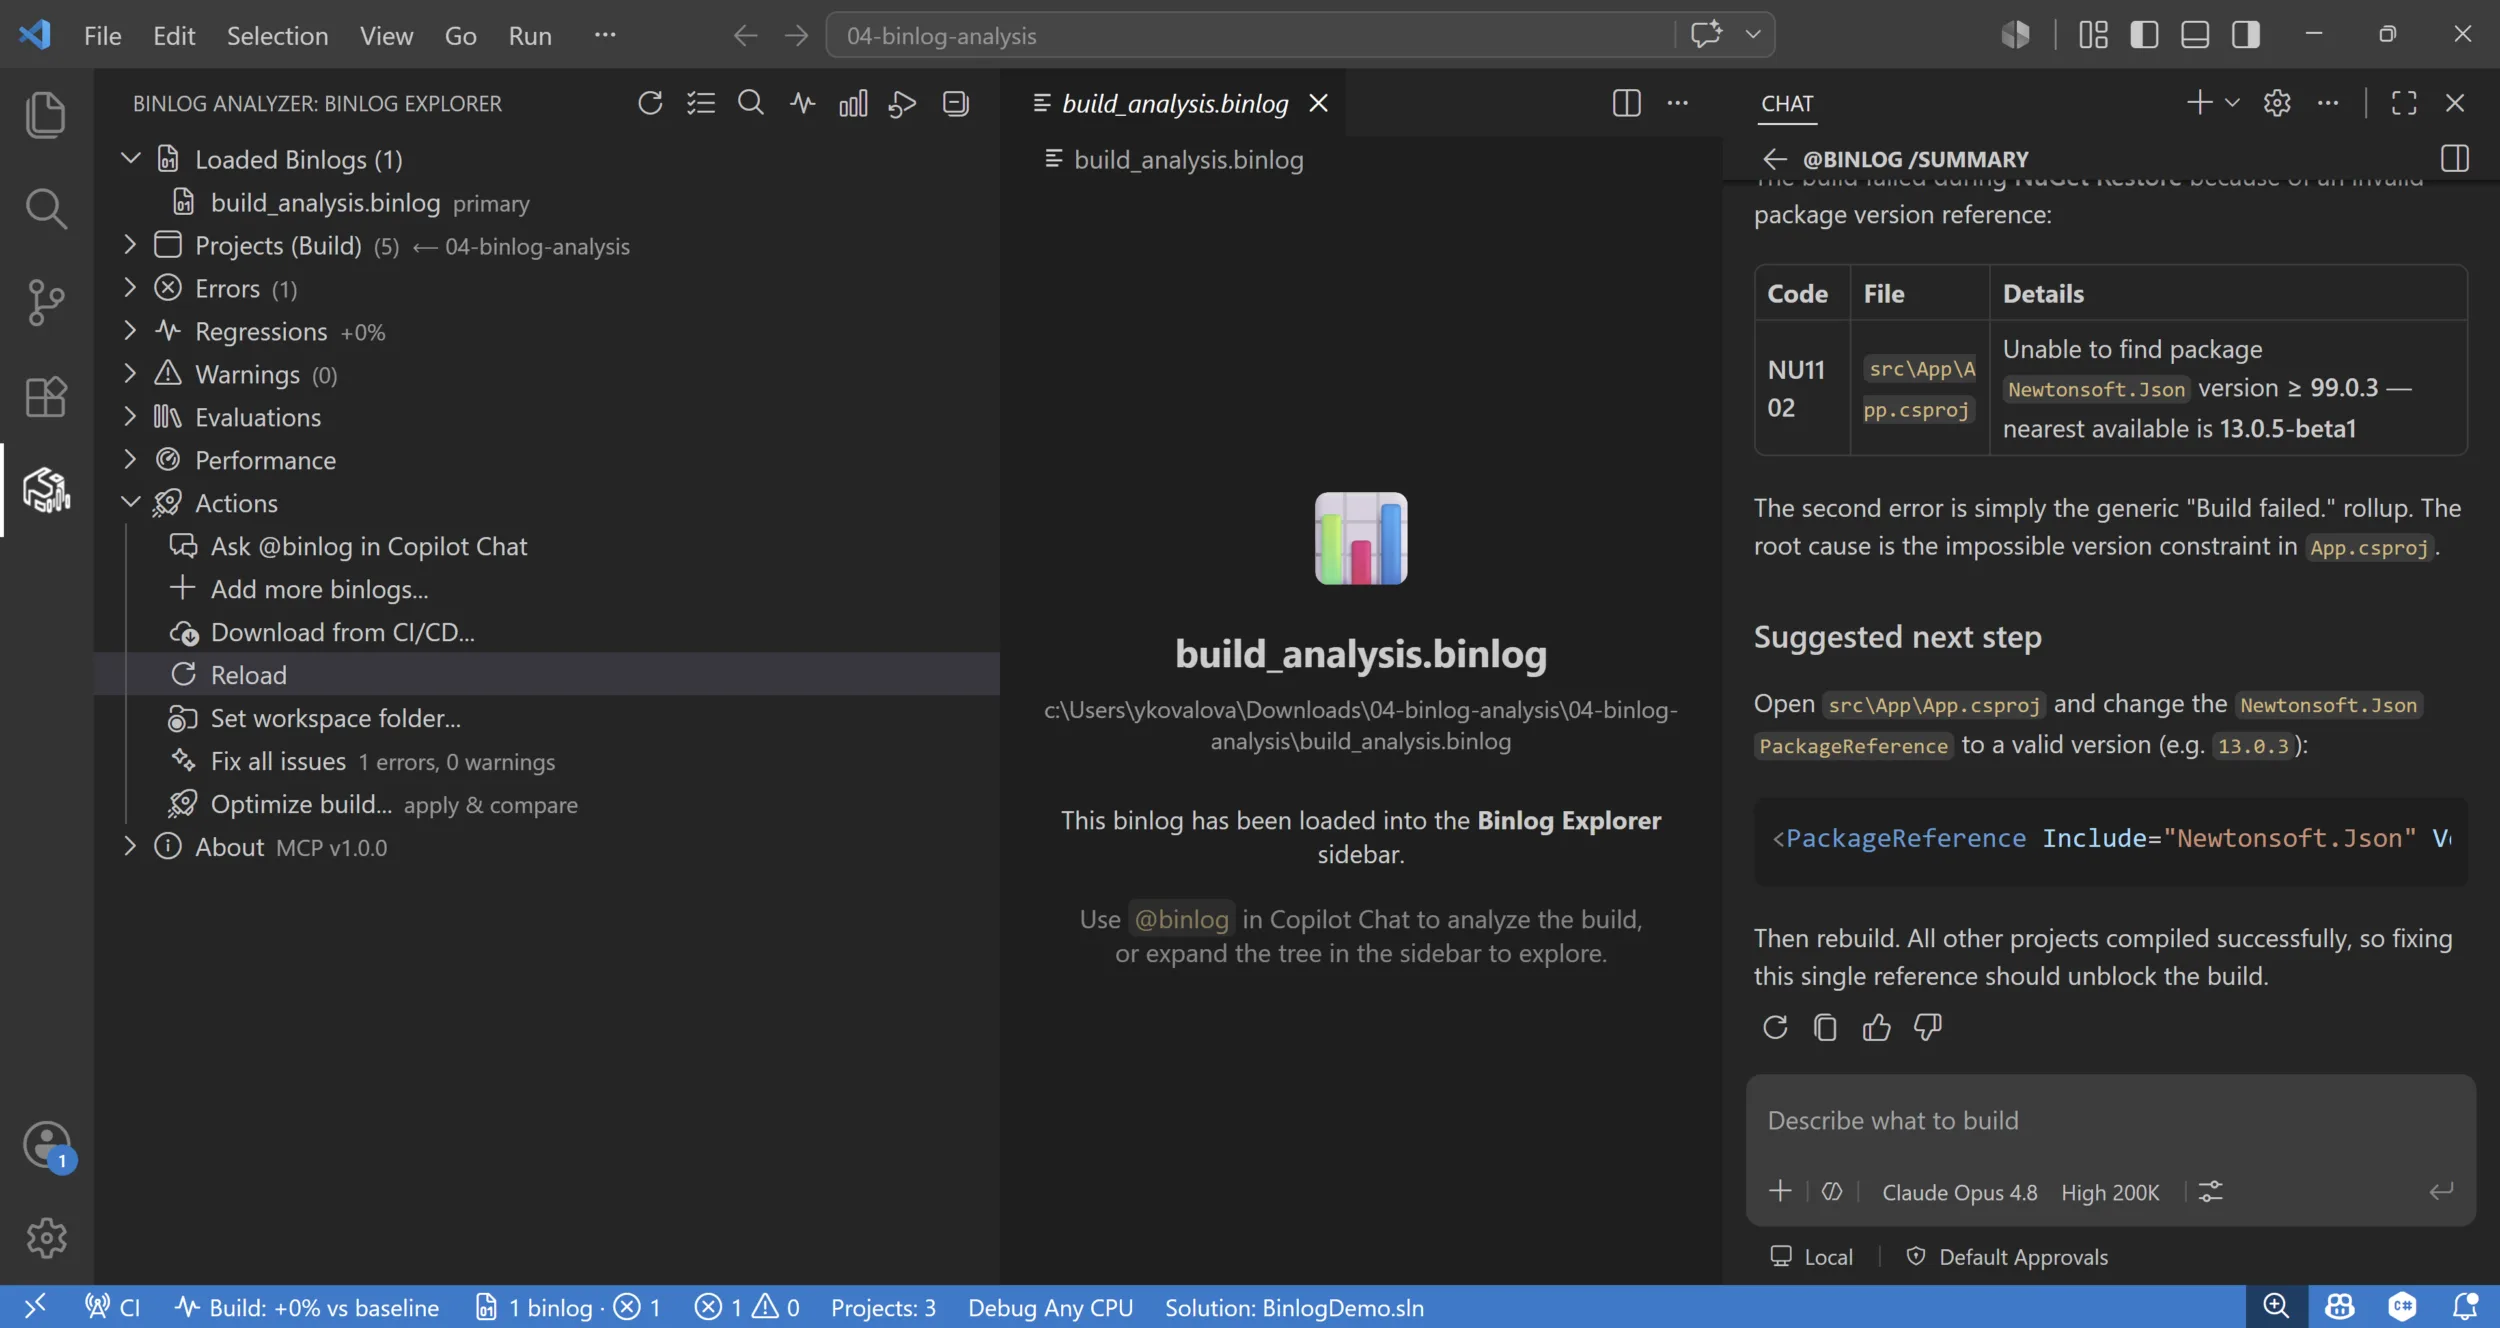
Set any loaded .binlog as a baseline, and every new build is compared
against it automatically. A Build: +X% vs baseline badge appears in the
status bar, and a Regressions node spells out exactly what changed: slower
targets, added or removed diagnostics, MSBuild property diffs, and NuGet package
version changes. Hand any single regression straight to @binlog to dig in.
Compare two builds, visually
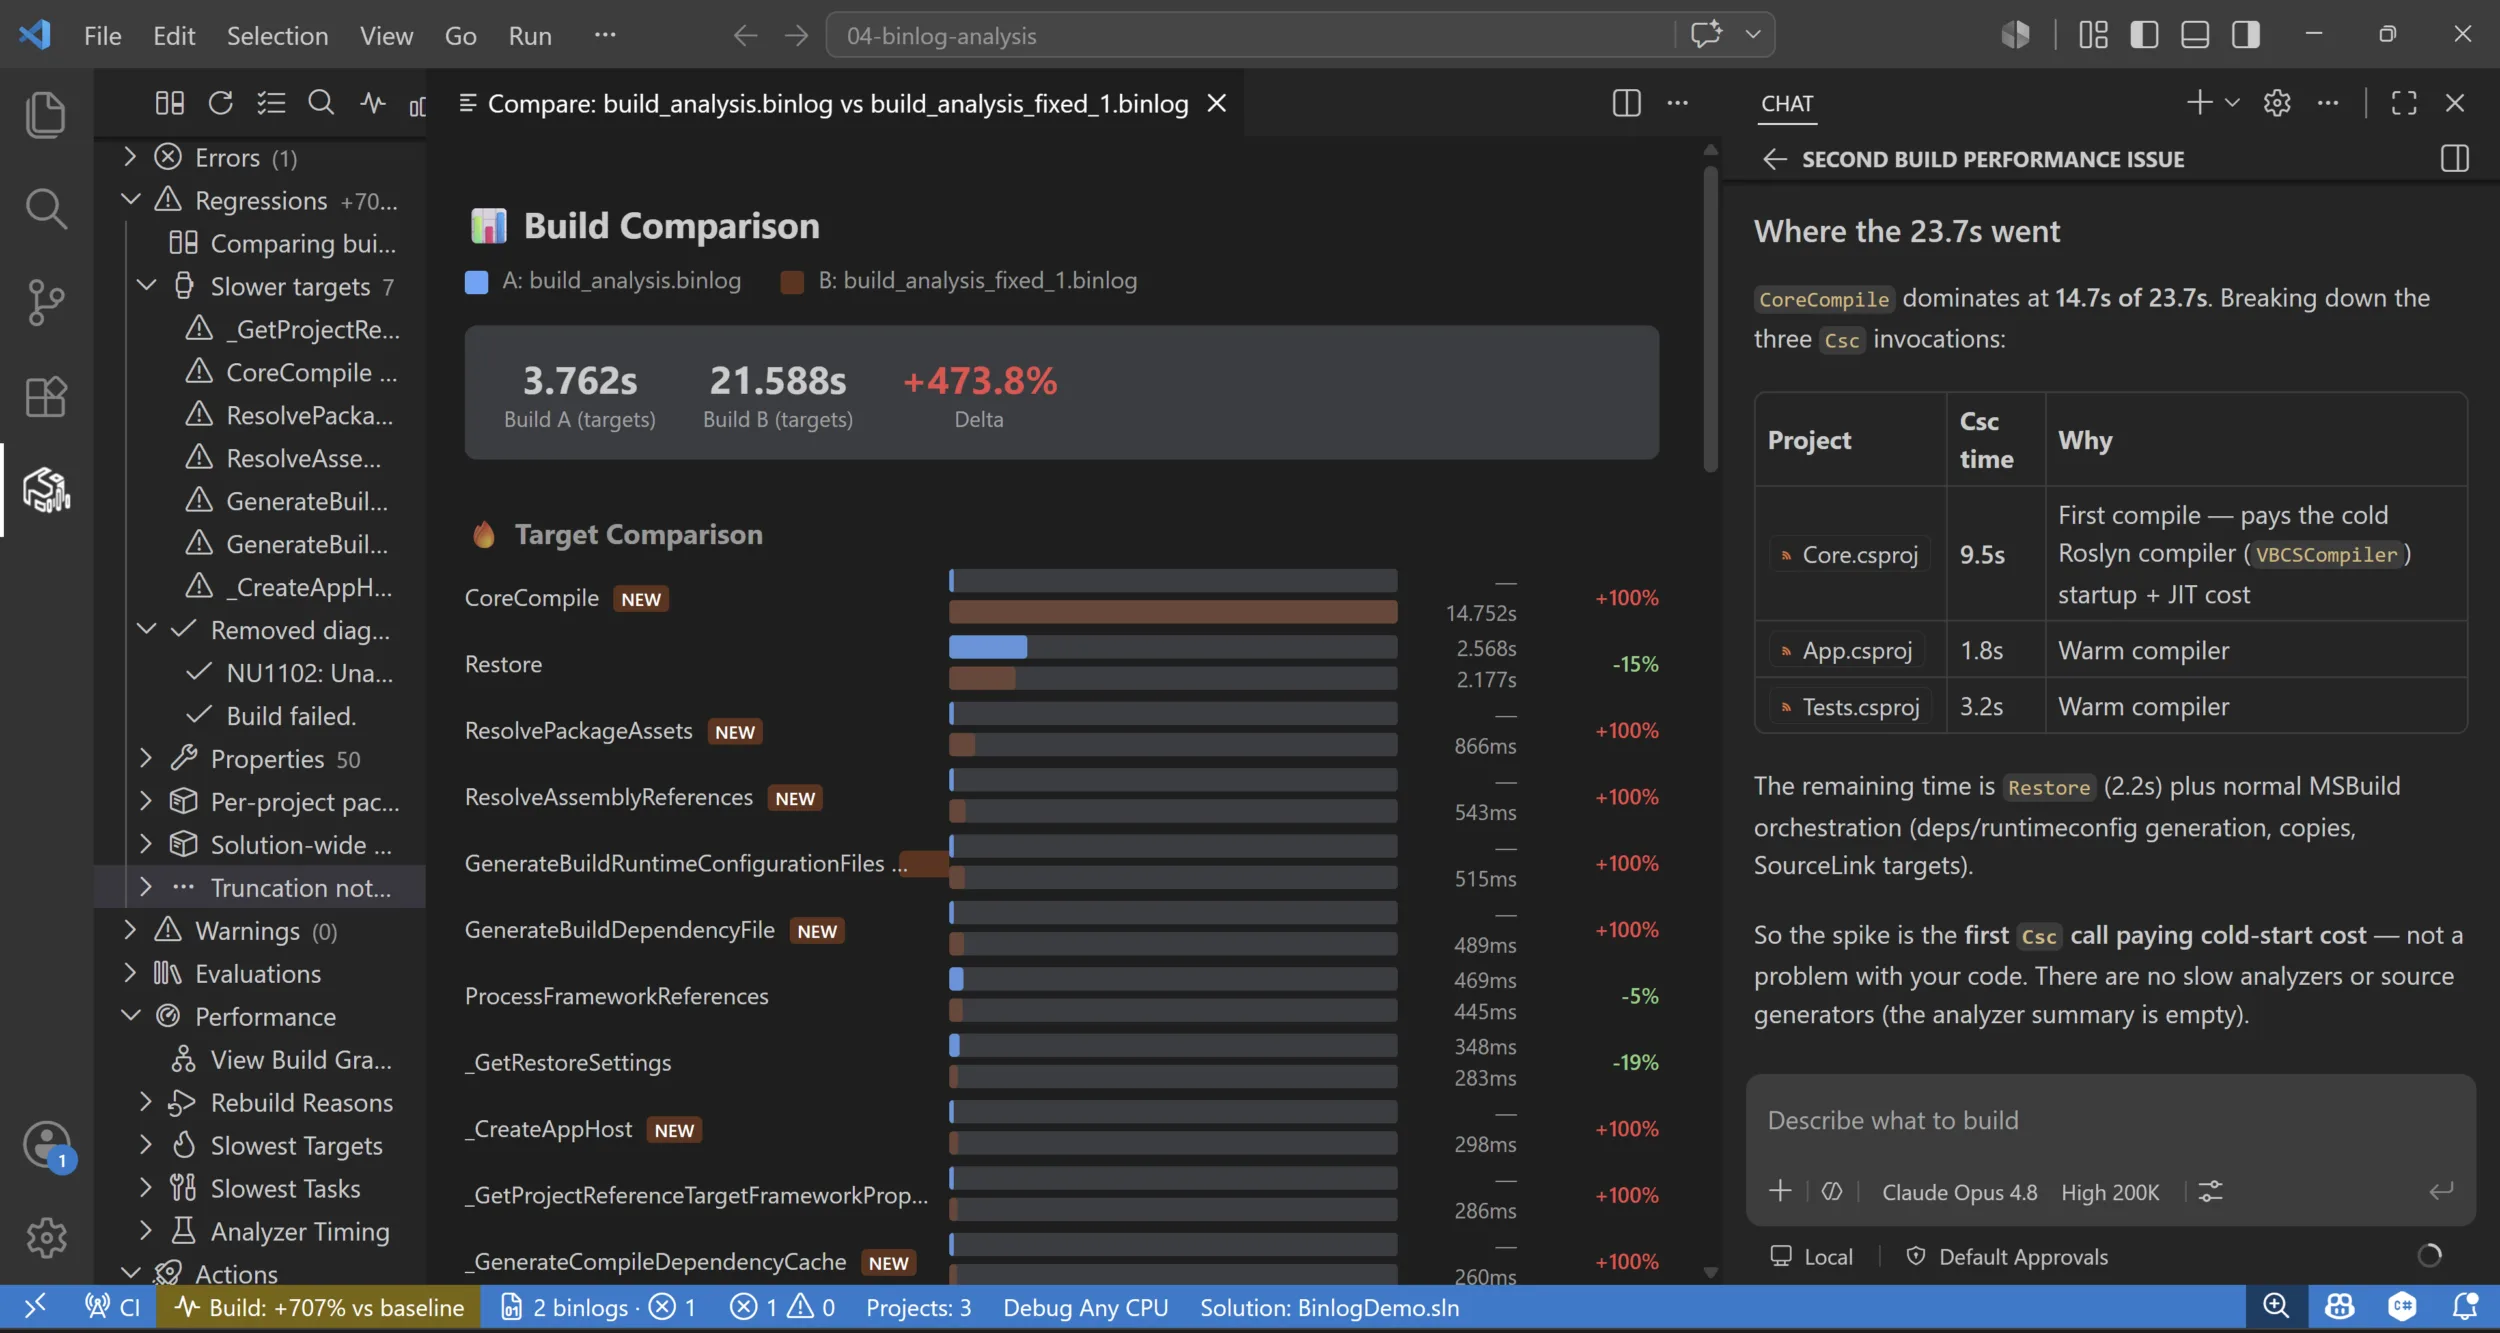
The Build Comparison view lines up two logs target-by-target with deltas,
and the project graph highlights the critical path computed by the MCP
server. In the example below, Copilot traces a +473% spike straight to a
cold-start CoreCompile and explains it’s a first-compile cost – not a problem
with your code. That’s the difference between a number and an answer.
And there’s more
The extension is packed with extras worth exploring:
- Build Timeline – visual bar charts of target and task durations, with click-to-analyze in Copilot.
- Optimize build – pick optimizations, let Copilot apply them, and verify the win with an automatic A/B comparison.
- CI/CD integration – download binlogs from Azure DevOps Pipelines and GitHub Actions, filtered by branch or PR, and analyze a failed CI build without leaving VS Code.
- Search – query across every build event: targets, tasks, messages, and properties.
- Language Model tools (
binlog_lm_overview,binlog_lm_errors,binlog_lm_search,binlog_lm_perf,binlog_lm_compare) – available to agent mode and custom chat modes, plus a ready-made Build Analysis chat mode that works with any agent.
Try it
The MSBuild Binlog Analyzer is in Preview and under active development.
Install it from the
Visual Studio Marketplace,
point it at a .binlog, and ask @binlog your next build question. The next
red build might just fix itself. We’d love your feedback.
Feedback
The MSBuild Binlog Analyzer is built in the open, and your feedback shapes where it goes next. Found a bug, hit a rough edge, or have an idea for a feature? Please open an issue in the dotnet/skills repository – bug reports, feature requests, and general feedback are all welcome. Let us know what’s working, what isn’t, and what you’d like to see next.
0 Comments
Log in to join the conversation.No comments yet. Be the first to share your thoughts.