
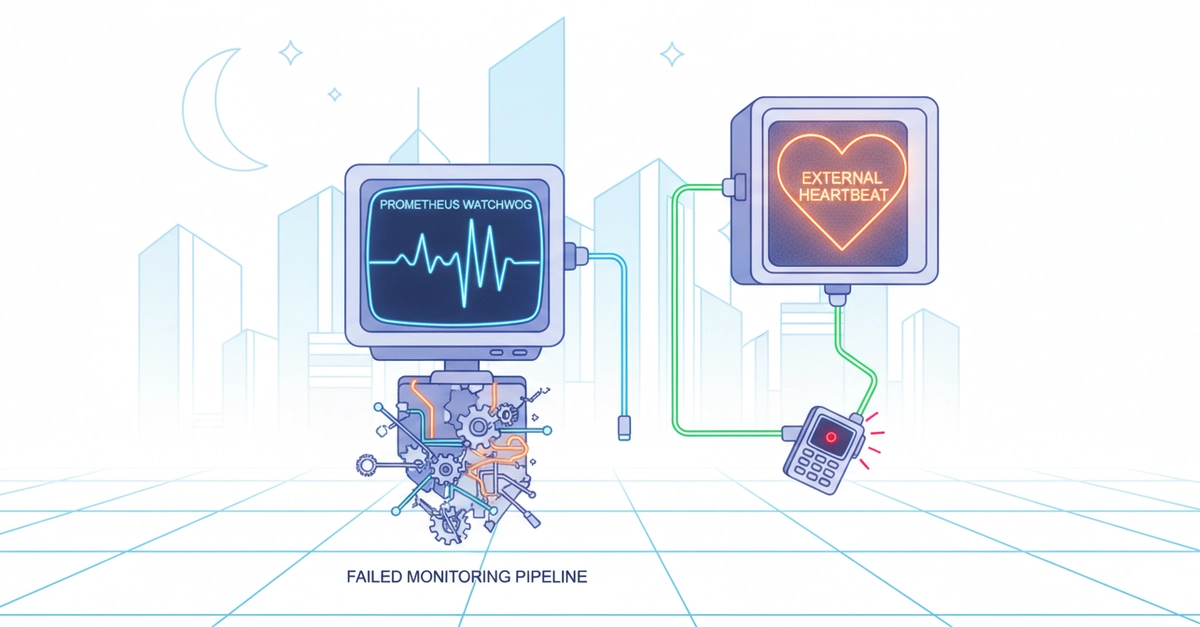
Your monitoring catches problems on everything except itself. Here is how an always-firing Watchdog alert plus an external heartbeat check turns silence into a signal, so you find out when your own alerting dies.
TL;DR
A monitoring system can't reliably monitor its own failure, so use a dead man's switch. Create an always-firing Prometheus Watchdog alert and route it to an independent external heartbeat service. As long as the monitoring pipeline is working, the Watchdog continuously refreshes the heartbeat. If Prometheus, Alertmanager, or the delivery path fails, the heartbeat stops and the external service alerts you through a separate channel. The key is independence: the system responsible for detecting that your monitoring is down must not depend on the monitoring stack itself.
One of the traps of creating alerts on a monitoring stack is the hidden assumption that the mechanism evaluating the alert is running properly and has the ability to evaluate it. Prometheus watches your hosts and Alertmanager delivers the warnings. But what watches Prometheus? If something goes wrong and the monitoring stack fails in the middle of the night, no alerts are going out but there is definitely a problem. That is the failure mode that you should be most concerned about, because it is the one your monitoring cannot report on.
The fix is an old idea with a grim name: a dead man's switch. A train's dead man's switch stops the train when the operator stops holding it down. The safe state requires continuous positive action, while the absence of that action is what triggers the response. Applied to monitoring, it means building one alert whose silence is itself the alarm.
Step one: an alert that always fires
This feels backwards the first time you see it, and it took me a little time to get it right. Basically, you create an alert with a condition that is always true, so it fires constantly, forever, on purpose. In the Prometheus world this is conventionally called Watchdog.
- alert: Watchdog
  expr: vector(1)
  labels:
    severity: watchdog
  annotations:
    summary: "Monitoring pipeline is alive"
Enter fullscreen mode Exit fullscreen mode
vector(1) is always true, so as long as Prometheus is evaluating rules at all, this alert is firing. It flows through Alertmanager just like any real alert. On its own it does nothing useful, it is just noise you would never want a human to see, which is the problem I initially ran into with my Alerts Dashboard. Its value is entirely in what its absence means. If the Watchdog stops firing, that tells you the evaluation-and-delivery pipeline itself has broken, which is the one thing no ordinary alert could ever tell you.
Because it fires constantly, you route it deliberately away from human channels. I give it its own severity: watchdog label and filter that severity out of every dashboard panel and human-facing route, so it never lands in anyone's Slack. It exists to be watched by a machine, not a person.
Step two: something outside the stack has to watch for the silence
Here is the crucial part that a lot of people miss on the first pass. The Watchdog alert cannot be checked by the same stack that produces it. If Prometheus and Alertmanager are what would notice the Watchdog going quiet, then when they die they take the noticer down with them, and that's no better than not having it.
So the watcher has to live somewhere else entirely, on infrastructure that fails independently. The best way to do this is a hosted heartbeat service. Alertmanager is configured to deliver the constantly-firing Watchdog to an external endpoint, effectively petting the switch on a schedule. That external service expects a ping at a regular interval and checks to make sure that if the ping does not arrive on time, it alerts you through a path that does not touch your monitoring stack at all.
The logic is inverted, and that's what threw me off when I first set it up. Your monitoring alerts you when a real problem occurs. The heartbeat service alerts you when an expected ping fails to arrive — the mirror image of that. If there's a real problem, you get a message. If monitoring itself dies, the pings stop, and the external service messages you about the silence. The two together cover the gap each leaves on its own.
Why the separation is the entire point
It is tempting to cut the corner and have the stack monitor its own health with an internal check. That gives you a comforting green panel that says everything is fine right up until the moment it cannot say anything at all, because the same outage that broke your alerting also broke the panel reporting on your alerting. A self-check is only ever as trustworthy as the system running it, and the system running it is what you also need to be keeping an eye on.
The dead man's switch works because it refuses that shortcut. The signal path for "your monitoring is down" runs entirely outside your monitoring, completely independent. The cost is one deliberately-useless alert and one small external service, and in exchange you close the single scariest gap in any observability setup: the silent death of the thing you were counting on to break the silence.
What this looks like running
In my stack the Watchdog fires continuously, carries its own severity: watchdog label so it stays out of every human channel, and gets delivered outward to a heartbeat check on a schedule. I also surface it as a single internal panel that reads "pipeline healthy" while the Watchdog is present and flips to "broken" the instant it goes absent, using a count() guarded with or vector(0) so the panel shows a real red state rather than an empty no-data tile when the alert stops arriving. That panel is for me, during normal working hours. The external heartbeat is what actually wakes me up, because it is the only part of the chain that will still be running when the rest of it is not.
If you run your own monitoring, this is worth the hour it takes to set up. Have you built a dead man's switch into your stack, and if so, did you route it to a hosted heartbeat service or roll your own external checker? I am always curious how other people close this particular gap.
0 Comments
Log in to join the conversation.No comments yet. Be the first to share your thoughts.