
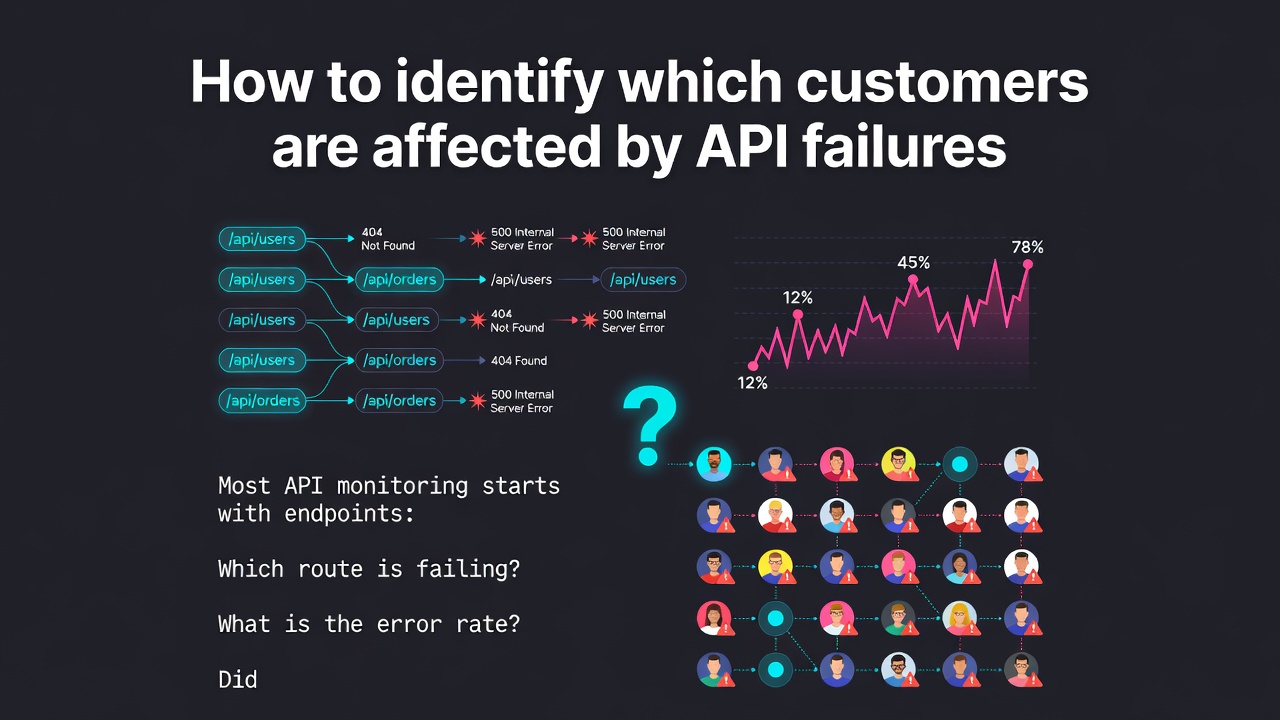
Most API monitoring starts with endpoints:
- Which route is failing?
- What is the error rate?
- Did latency increase after a release?
Those questions are essential, but they are often not enough for a B2B SaaS product.
When an integration starts failing, the operational question quickly becomes:
Which customers are affected, and how badly?
That information is usually scattered across logs, support tickets, account records, deployment history, and application-specific dashboards. This article describes a simple model for making customer context a first-class part of API observability.
The missing dimension in API monitoring
Imagine that a new release causes an increase in 422 responses on this endpoint:
POST /v2/invoices/{invoice}/send
Enter fullscreen mode Exit fullscreen mode
A conventional monitoring dashboard may tell you that the error rate increased from 1% to 8%. But before engineering, support, or customer success can respond, they still need to determine:
- whether the failures affect one customer or many;
- which consuming applications are involved;
- whether affected customers use the same API or SDK version;
- whether the regression began after a specific release;
- which high-value or newly onboarding customers need attention first.
Endpoint-level metrics describe the technical failure. Customer context describes its business impact.
Add customer context at the request boundary
The most reliable place to add this context is after authentication, when the application already knows who is making the request.
Instead of recording a concrete URL or the full request, emit a small operational event:
{
  "occurred_at": "2026-07-31T10:20:30.123Z",
  "service": "billing-api",
  "environment": "production",
  "method": "POST",
  "route": "/v2/invoices/{invoice}/send",
  "status": 422,
  "duration_ms": 142,
  "customer_id": "company_128",
  "application_id": "erp_connector_42",
  "api_version": "v2",
  "release": "2026.07.31.1",
  "sdk": "laravel",
  "sdk_version": "1.0.0",
  "error_code": "MISSING_RECIPIENT"
}
Enter fullscreen mode Exit fullscreen mode
Several details matter here:
- Use a normalized route such as
/invoices/{invoice}rather than a concrete resource URL. - Use stable customer and application identifiers rather than mutable display names.
- Prefer a stable domain error code over an exception message.
- Include release and version information when it is available.
- Keep collection away from the response path so telemetry problems cannot break the API being observed.
This creates a dataset that can be analyzed by endpoint, release, version, customer, or consuming application without storing the business payload.
Keep the privacy boundary intentionally small
Customer-aware monitoring does not require capturing customer content.
For most integration-health questions, the useful fields are limited to:
- normalized route and HTTP method;
- response status and duration;
- stable customer and application IDs;
- service, environment, release, API version, and SDK version;
- a stable error code;
- a small set of explicitly allowed operational metadata.
Request and response bodies, credentials, cookies, query strings, and client IP addresses do not need to become analytics dimensions.
This boundary reduces security risk and makes the monitoring model easier to explain during privacy and procurement reviews.
What becomes possible
Once request telemetry includes customer context, several useful views become straightforward.
Incident blast radius
Rank affected customers and applications by error count or failure rate. Support can contact the right accounts while engineering investigates the underlying endpoint or release.
API version adoption
Measure traffic share by API version and produce an exact list of customers that still use an older contract. This is more actionable than a global percentage when planning a deprecation.
Release impact
Compare a release with its preceding baseline, then identify both the regressing endpoints and the customers exposed to them.
Integration journey
Track milestones such as first request, first successful response, first production use, endpoint adoption, and regular activity. This makes stalled onboarding visible before it becomes a support escalation.
Customer health
Combine activity, reliability, performance, endpoint adoption, and usage regularity into an explainable customer-level view. The individual components are more important than an opaque score.
Build this into your existing stack or use a focused tool?
You can build customer-aware views on top of an existing telemetry platform. The main engineering work is usually not sending another metric; it is consistently resolving customer identity, controlling cardinality, normalizing routes, defining privacy boundaries, and turning raw events into useful customer-level workflows.
I built Apirelio as a focused implementation of this model for B2B APIs.
It currently provides integrations for Laravel, Symfony, Nette, Express, Fastify, NestJS, Nuxt, and FastAPI. It includes customer and endpoint analytics, incident impact, API version adoption, release comparisons, integration journeys, alerts, and scheduled reports.
There is a free plan for up to 50,000 events per month, with no credit card required. The documentation shows the event model and framework-specific setup.
The product is still early, and I would especially value feedback on two questions:
- Should customer-aware API observability remain a focused product, or should it primarily feed existing observability platforms?
- Which framework or integration would you need before trying this approach?
0 Comments
Log in to join the conversation.No comments yet. Be the first to share your thoughts.