
It's Monday afternoon and that feature you've been working on is mostly done. There's just one item still sitting untouched at the bottom of the ticket: "Add monitoring."
You know you should. You also know the sprint ends tomorrow, nobody on the team is an observability expert, and figuring out what to measure—let alone how to write the PromQL for it—feels like a project all on its own. So it gets the same treatment it always does: "We'll add it when it breaks."
The trouble is, that break has a nasty habit of happening at 2 a.m. on a random Tuesday a few weeks later. Yes, you're the same engineer, working on the same service, except now there's no dashboard, no useful signal, and a lot of guessing under pressure. The instrumentation you skipped to save an afternoon costs you a night—and a slow, stressful incident on top of it.
The truth is this: observability doesn't get deferred because engineers don't care; it happens because it's seen as the domain of experts and hard to plan for upfront. But given the rapidly changing landscape of software development, that's an assumption worth challenging.
Observability isn't a phase you bolt on at the end; it's a decision that belongs at every stage of building and running software. And with Grafana Assistant, that's finally realistic for any team—regardless of whether or not you have observability specialists on staff.
In this blog post, I'll show you how to do exactly that, starting at the earliest stage: planning.
Meet Assistant—and why OSS is the cheat code
Before we get into how you can bake observability in from the beginning, let's get you up to speed on Assistant, the context-aware AI agent that lives inside Grafana Cloud. You describe what you want in plain language and it takes real action against your telemetry—querying your data, drafting dashboards, navigating to the right place, and helping you investigate.
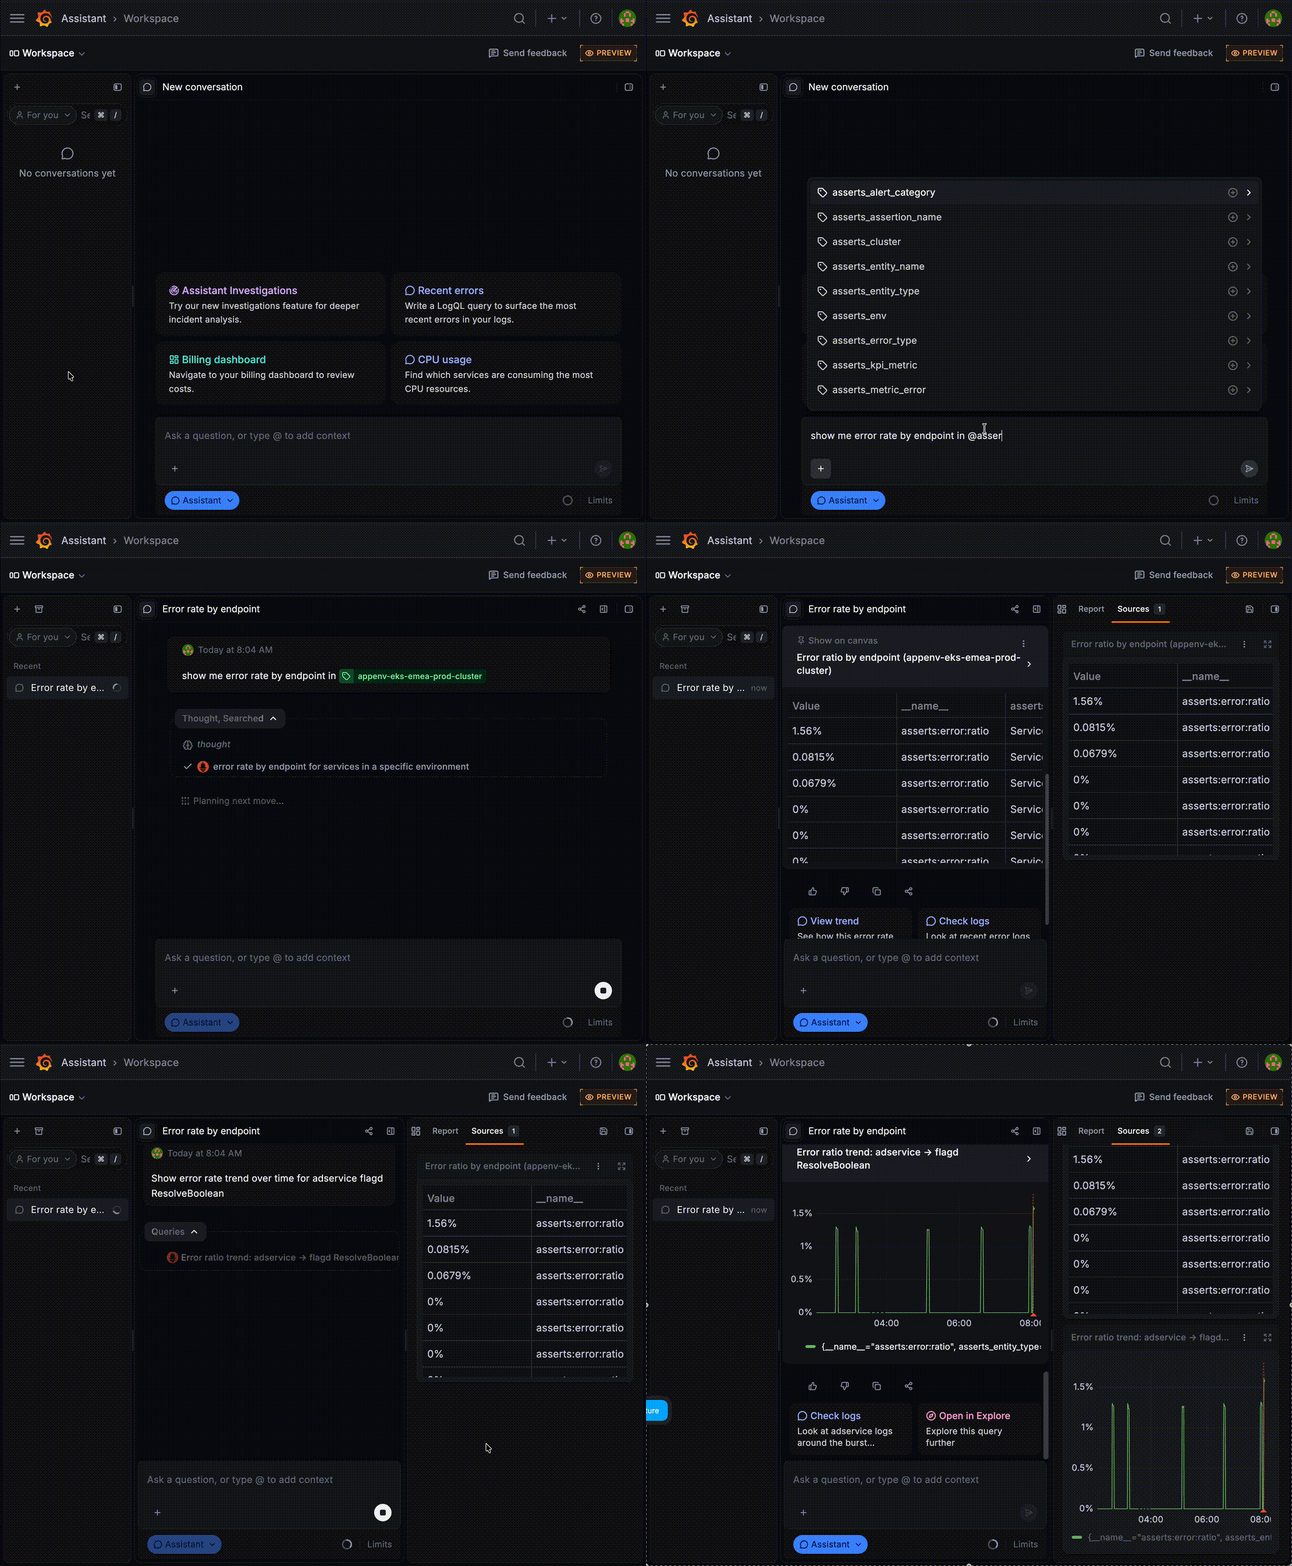
This makes observability approachable to any engineer. For example, have you always wanted to understand what's wrong with your application but haven't had time to learn PromQL? Well, now you can just type in "Show me error rate by endpoint for this service" and you'll get the answer in seconds.
And here's the part that truly separates Assistant from other AI tools: open source is the cheat code. Grafana, Prometheus, Loki, Tempo, and OpenTelemetry are open, ubiquitous, and exhaustively documented. Large language models have already absorbed their query languages, conventions, and best practices. That expertise is baked into the model before you type a single word. Closed, proprietary tools don't get that for free; open standards do.
Assistant builds on that foundation and then grounds it in your environment: your data sources, your dashboards, even the page in Grafana you're on right now. So you get the collective knowledge of the open source observability community, applied to your specific stack. Lacking a dedicated observability team is no longer a blocker, and observability can move all the way to the beginning instead of being tacked on at the end.
Increasingly, that work happens in Grafana Assistant Workspace, which provides a dedicated, full-page and AI first experience for longer conversations and more complex workflows. Instead of juggling a sidebar, dashboards, and separate reports, Workspace keeps your conversation, visual output, and investigation artifacts together so you can stay focused as you move from planning to implementation.
There's a catch, though: planning rarely happens on a blank page. Most real systems are brownfield—any new feature or service you build plugs into things that already exist, half of which you didn't write. So planning observability well takes two moves. First, you need to get your bearings and understand what's already running. Then you need to design the next piece with observability built in from Day One. Let's walk through both.
Move one: onboarding onto what's already there
Planning almost never starts from nothing. Before you can add anything sensibly, you have to understand the system you're adding to—and that's exactly where a lot of observability effort quietly evaporates. So the first move is onboarding.
To illustrate how this can become reality at your organization, let's walk through a hypothetical scenario.
You're a week into a new team responsible for dozens of services. You didn't build any of them, and, naturally, something is already breaking. You don't know the architecture, which service owns what, or where the useful signals are. Normally this is days of Slack archaeology and nudging the one person who remembers how it all fits together, but it doesn't have to be that way anymore.
Instead, you get up to speed quickly with Assistant. Simply open Assistant and ask it something you'd otherwise need a senior engineer for: "Map the services around checkout and tell me what's degrading right now." Working step by step, Assistant pulls in context from the Knowledge Graph—Grafana Cloud's live map of your services, their dependencies, and how signals connect—so instead of a wall of raw metrics you get a picture of what talks to what and where the trouble actually is.
That type of head start is exactly what teams using Assistant describe:
"I'm sad that this tool didn't exist two or three years ago when we were onboarding. I think it would have cut out probably 50% of the questions we got." —Chris Carter, Lead Software Engineer, OutSystems
Digging in, you spot the real problem is that the observability itself has gaps: a critical service with no latency panel; an error metric nobody graphs. So you close those gaps on the spot. Describe what you want—"Show me error rate and p99 latency for checkout"—and Assistant finds the data sources, writes the PromQL and LogQL, and renders live panels right in the chat so you can sanity-check real data before committing. Say: "Turn these into a dashboard," and in dashboarding mode it builds the panels, adds variables like a $service selector, and saves it straight to Grafana Cloud with a deep link back.
A few of the concrete details it's genuinely good at in this example:
Natural language → PromQL, LogQL, and TraceQL: You see the query as it's built, so you learn the stack as you go.
Live panels in the chat: You see actual data before you save any change; no need to guess if the assistant is making the right recommendation.
Dashboarding mode: Build and edit panels, variables, and layout just by describing them.
@-mention existing dashboards, data sources, and queries: Ground any request in what you already have.
The best part: you can make this entire process—checking the Knowledge Graph, pulling the dashboards, looking for those gaps—repeatable. By using an Assistant Skill, you can create a reusable slash command such as /onboard-service . That way, the next new hire can get oriented on your system in minutes instead of days, and you've turned a painful first week into a paved path.
"It probably saved us about a week of onboarding … and probably took half or a third of the time for dashboarding." —Mark Cicoria, Transmute Data
Move two: planning the new piece so the gap never forms
Now that you understand what's already running, you can plan the new piece properly. And this is where adding observability from the start pays off the most—the same assistant that helped you get your bearings is even more useful before a service exists in the first place.
Decide what to measure, then build it
At design time, ask: "What should I monitor for a new payments service?" Assistant leans on well-worn methods like RED (rate, errors, duration) and USE (utilization, saturation, errors) to tell you which signals matter and what "healthy" should look like. It essentially provides the same type of expert guidance you'd otherwise have to rely on an experienced SRE for.
Then it turns that plan into the thing Grafana is built around: dashboards, the shared, at-a-glance view a whole team reasons from. Historically, this is the part that takes the most expertise and patience to get right. But in dashboarding mode, Assistant does the heavy lifting in chat, before you've shipped a line of code. It writes the queries, lays out the panels, and adds variables so a single dashboard scales across every instance and environment. The starter dashboard that used to be a week of fiddling is ready the moment the service is.
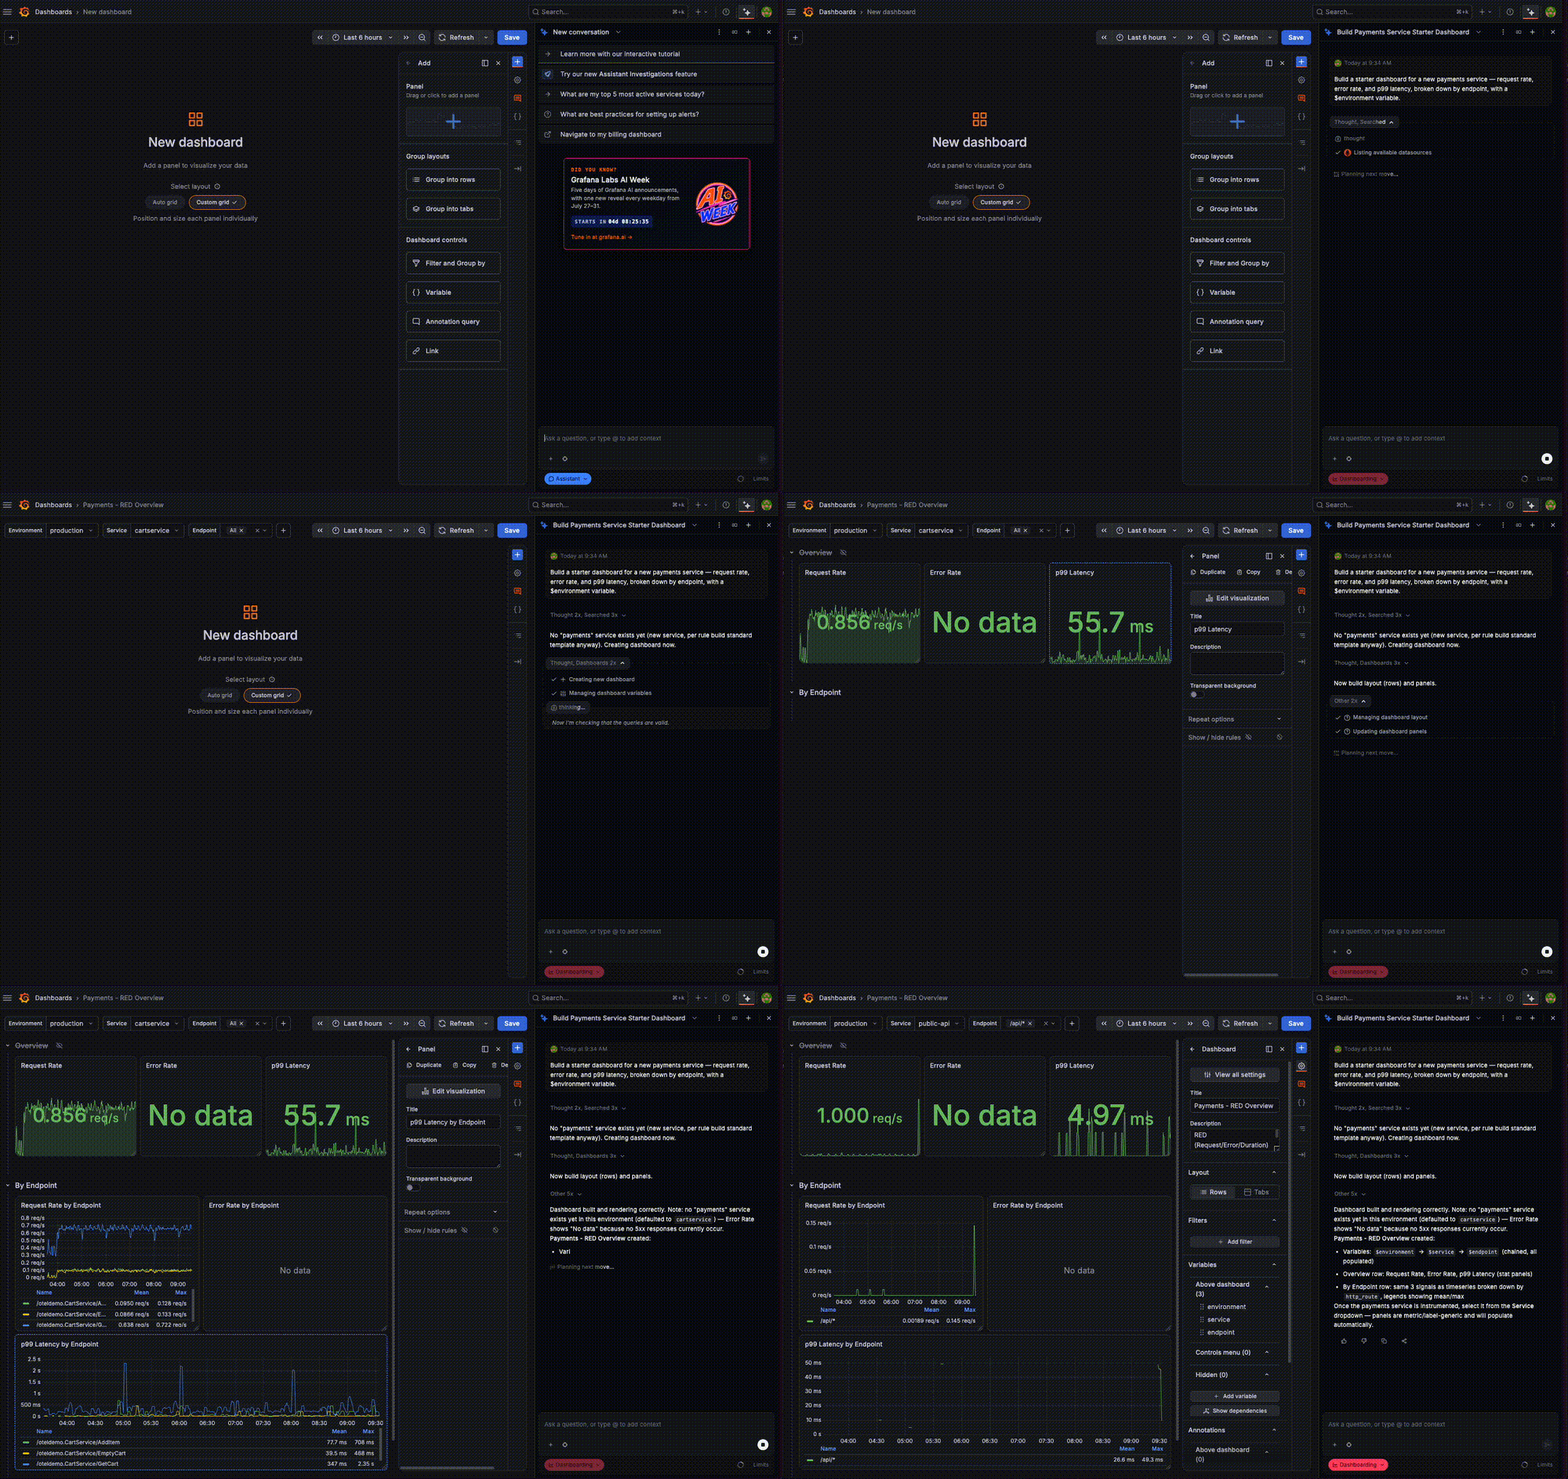
If you have Assistant enabled already, you can follow the link below to try this prompt now: "Build a starter dashboard for a new payments service — request rate, error rate, and p99 latency, broken down by endpoint, with a $environment variable."
Deciding what to alert on is part of that same conversation, even though the alert rules and SLOs themselves are still best provisioned through infrastructure-as-code or the Grafana Cloud UI. Assistant helps you make the call; your existing workflows own the provisioning.
Bring in the rest of your stack
And observability rarely lives in Grafana alone, since the context you need is scattered across your code, your pull requests, and your incident history. MCP servers bring it together: connect Assistant to the tools you already use—GitHub, Jira, PagerDuty, and more—and it can read a service's code to suggest what to instrument, cross-reference a recent deploy, or pull up a past incident, all from the same chat.
Pair that with a Skill that auto-approves the tools it needs, and your planning flow reaches across the whole stack — so observability is designed in from the very start, with the full picture in view, not bolted on after the incident.
The payoff: faster answers when things break
Which brings us back to that 2 a.m. call—except this time it's different, because the observability was there from the start.
The dashboards you built at planning time are already showing you what's happening. The Skill your team encoded means the runbook is one command away. And with Assistant connected to your other tools through MCP, the recent deployment or the related incident that explains the spike is one question away, too. Just ask, in plain language: "What changed in the last hour for checkout?" No more hand-writing PromQL under pressure.
This is the return to where observability always should have been included: baked in from the start. The upfront effort you spread out along the way—a few minutes here at design time, a Skill or two there—compounds into dramatically faster answers on the worst night of the sprint.
Grafana Assistant is the easiest way to get started with metrics, logs, traces, dashboards, and more in Grafana Cloud. We have a generous forever-free tier and plans for every use case. Sign up for free now!
Tags
0 Comments
Log in to join the conversation.No comments yet. Be the first to share your thoughts.