
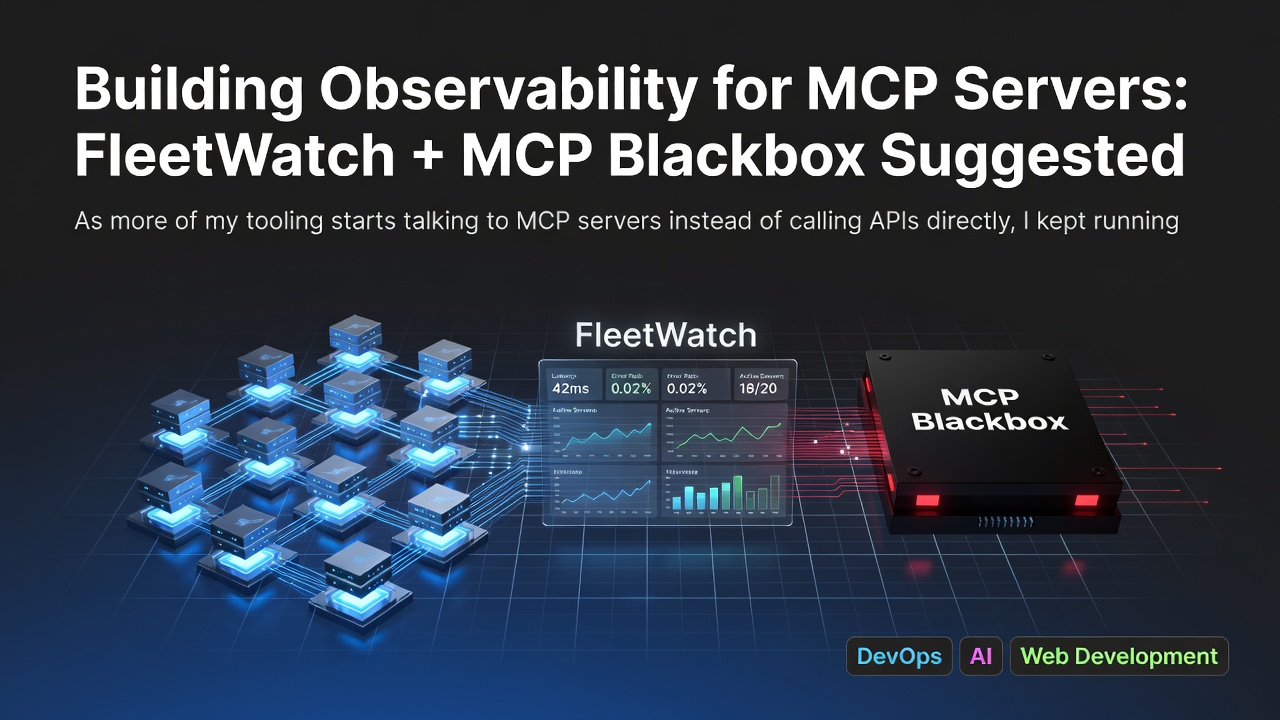


- As more of my tooling starts talking to MCP servers instead of calling APIs directly, I kept running into the same gap: there's no lightweight way to know when an MCP server goes down, and no way to see what actually happened when something breaks mid-run. So I built two small, focused tools to close that gap — FleetWatch and MCP Blackbox.
The problem
MCP servers are quickly becoming the standard way AI agents reach tools, but the ecosystem is still missing basic infrastructure plumbing: uptime monitoring, latency tracking, and forensic debugging. When an agent run fails, "the MCP server did something weird" is usually where the trail goes cold.
I wanted both tools to stay narrow and not overlap with things I'd already built (mcp-schema-watch for schema drift, skillcheck for SKILL.md linting, Swarm Trace Viewer for swarm-run analysis). So FleetWatch and MCP Blackbox split the job in half — one watches, one records.
🩺 FleetWatch — uptime & health monitoring
FleetWatch pings your registered MCP servers on a schedule and tracks:
- Uptime — is the server actually reachable
- Latency — how long it's taking to respond
- Response correctness — not just "did it respond" but "did it respond the way it should"
The moment a server goes down, degrades, or recovers, FleetWatch fires an alert. It's built with TypeScript, NestJS, and Next.js, communicates over WebSockets for live status updates, and ships with a full test suite plus a GitHub Actions CI workflow.
🔗 https://github.com/DIYA73/fleetwatch
🕵️ MCP Blackbox — the forensic layer
FleetWatch tells you something broke. MCP Blackbox tells you why.
It's a recording proxy that sits in front of your MCP traffic and captures full request/response payloads. The interesting design decision was around retention: instead of keeping everything (expensive) or nothing (useless when you actually need it), Blackbox permanently pins anything around a failure and prunes the rest. A flight recorder for your MCP servers — the data you need, right when you need it, without the storage bill of logging forever.
Same stack as FleetWatch — TypeScript, NestJS, Next.js, WebSockets — so the two integrate cleanly.
🔗 https://github.com/DIYA73/mcp-blackbox
Built to work together
FleetWatch and MCP Blackbox are deliberately separate — you can run either one on its own. But paired together, the workflow is simple: FleetWatch catches the failure in real time, and Blackbox already has the trace waiting for you.
Both are open source and public on GitHub — issues, stars, and PRs are always welcome. If you're building on MCP and hitting the same "I have no idea what just happened" wall, I'd love to hear how you're solving it.
0 Comments
Log in to join the conversation.No comments yet. Be the first to share your thoughts.