
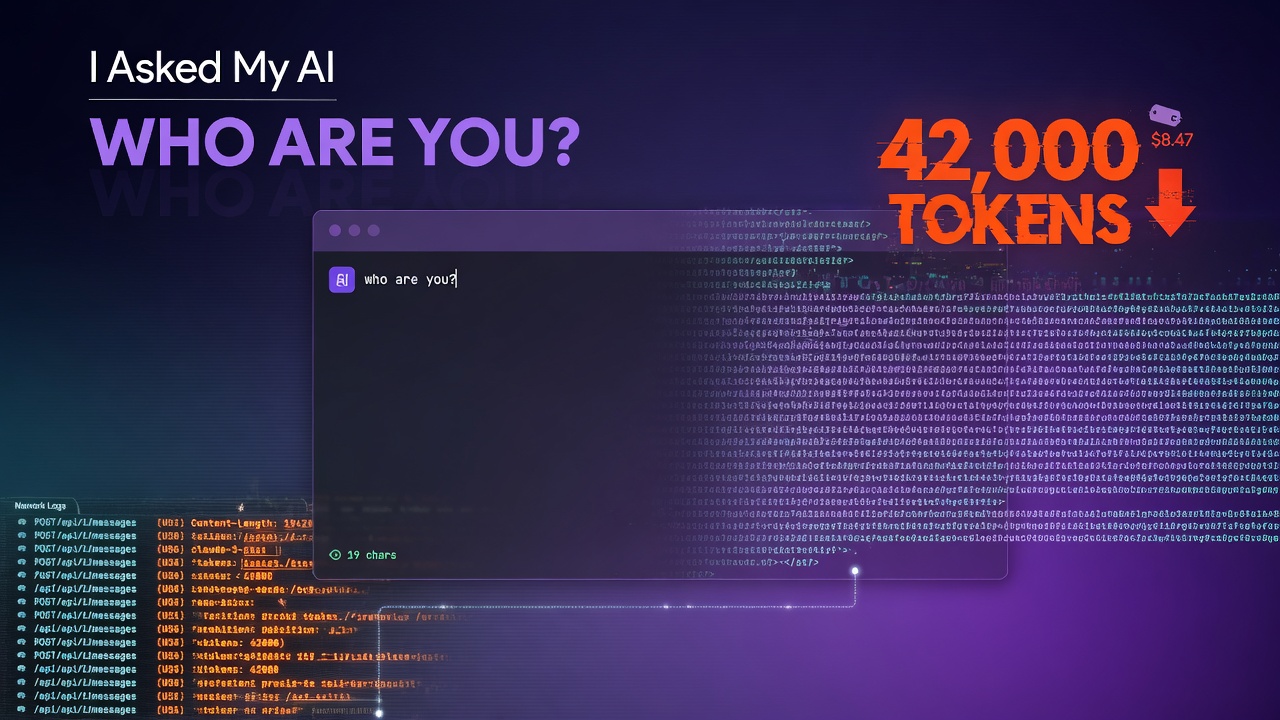
I typed a 19-character question into Claude Code:
who are you?
Then I opened the network logs of what my machine actually sent over the wire. I recommend you never do this. It ruins something in you.
The numbers
My question was 19 bytes. The request that carried it was 118,693 bytes.
That's a 6,200x amplification before the model reads a single word I wrote. My actual message was 0.016% of the payload. If this were a letter, I'd be mailing a phone book with a Post-it note inside.
Here's the pie, byte for byte:
| What | Bytes | Share |
|---|---|---|
| 38 tool JSON schemas | 78,935 | 66.8% |
| System prompt (behavior manual, safety rules, my git status) | 22,178 | 18.8% |
| A list of 60 more tools it could load, plus 25 skill descriptions | 16,844 | 14.3% |
| My memory files, my email address, today's date | 1,126 | 1.0% |
| My question | 19 | 0.016% |
And the tool schemas aren't even schemas, mostly. Of those 78,935 bytes, only 29,164 are machine-readable JSON schema. The other 44,392 bytes are English prose — instruction manuals for the model, shipped on every single request. One tool alone, Workflow, carries a 19,012-byte description. That's a small essay. It rides along on every message I send, forever, whether I orchestrate a multi-agent workflow or just say "hi."
Sixteen of the 38 tools are for driving a browser preview I never opened. There's an iOS Simulator controller in there. I was asking a chatbot its name.
The full manifest, since you asked
Every tool schema in that request, largest first. "Prose" is the English description; "schema" is the actual machine-readable part. Approximate tokens = bytes ÷ 4.
| Tool | Bytes | Prose | Schema | ~Tokens | Did I need it? |
|---|---|---|---|---|---|
| Workflow (multi-agent orchestration) | 21,609 | 19,012 | 1,833 | ~5,400 | No |
| Artifact (publish web pages) | 10,679 | 6,358 | 4,002 | ~2,670 | No |
| AskUserQuestion | 4,371 | 1,097 | 3,149 | ~1,090 | No |
| iOS Simulator control | 3,976 | 1,307 | 2,518 | ~990 | No |
| ScheduleWakeup (self-pacing loops) | 3,942 | 2,685 | 1,068 | ~985 | No |
| visualize show_widget | 3,038 | 648 | 2,259 | ~760 | No |
| Agent (spawn subagents) | 3,037 | 1,574 | 1,342 | ~760 | No |
| Bash | 2,860 | 1,290 | 1,456 | ~715 | No (but fair) |
| ReportFindings (code review UI) | 2,314 | 574 | 1,646 | ~580 | No |
| Browser computer (mouse/keyboard) | 2,141 | 193 | 1,837 | ~535 | No |
| Skill | 1,699 | 1,244 | 345 | ~425 | No |
| Read | 1,670 | 790 | 776 | ~420 | No |
| Browser preview_start | 1,656 | 1,328 | 143 | ~415 | No |
| spawn_task (background task chips) | 1,553 | 664 | 765 | ~390 | No |
| ToolSearch (loads MORE tools) | 1,522 | 953 | 427 | ~380 | No |
| mark_chapter (session table of contents) | 1,092 | 699 | 256 | ~275 | No |
| Edit | 1,037 | 360 | 584 | ~260 | No |
| dismiss_task | 918 | 560 | 234 | ~230 | No |
| + 20 more (browser tabs, navigation, console readers, form filler, widget reader, Write…) | ~9,800 | — | — | ~2,450 | No |
| Total | 78,935 | 44,392 | 29,164 | ~19,700 | 0 of 38 used |
Read that last column again. The model answered my question using zero of the 38 tools it was handed. Then notice ToolSearch: a tool whose only purpose is to fetch even more tools — there are ~60 additional ones (WebSearch, WebFetch, cron schedulers, task managers, notebook editors, a whole second browser that drives my real Chrome, password-manager integration) waiting behind it, listed by name in that 16.8KB deferred-tools block. The request contains a tool for requesting tools. We have achieved tool-calling recursion.
The prose-to-schema ratio is the tell. Workflow's description is 19KB of instruction manual — pipeline semantics, barrier vs. no-barrier philosophy, seven design patterns with code examples, a "smell test" for when you're using it wrong. It's genuinely well-written documentation. It is also transmitted to a datacenter every time I type "ok".
What you can actually turn off (and what you can't)
I audited my own machine after this. Here's the honest control surface, verified against my actual config files — with guesses labeled as guesses.
Things I verified you CAN control:
-
Your own hooks. Mine injects a paragraph of instructions into every prompt I send (my doing,
~/.claude/settings.json). Delete the hook block, it's gone. -
Memory files. Plain markdown in
~/.claude/projects/<project>/memory/. Delete them, they stop being sent. (The app injecting my email address alongside them — that part has no knob.) -
Plugins. My skill list was fattened by exactly one thing I installed: the official
anthropic-skillsplugin. Uninstalling it removes ~25 skill descriptions from every request. -
Telemetry env vars.
DISABLE_TELEMETRY=1,DISABLE_ERROR_REPORTING=1,CLAUDE_CODE_DISABLE_NONESSENTIAL_TRAFFIC=1are documented switches for the ~600KBtengu_*firehose. (Documented — I haven't packet-captured a session with them on yet. Trust, but HAR-verify.) -
The entrypoint. The desktop app injects ~20 MCP tool schemas (browser preview, iOS simulator, visualization widgets, session chips) that plain terminal
claudedoesn't load. Using the terminal is the single biggest schema diet available to a normal user.
Things you CANNOT control, period:
-
The core toolset. Workflow's 21.6KB, Artifact's 10.7KB, all of it — baked into the binary, gated by server-side feature flags (
tengu_workflows_enabled: true,tengu_report_findings_tool: true,tengu_chrome_auto_enable: true). There is a--disallowedToolslaunch flag on the CLI, but the desktop app exposes no such thing in its UI. - The 20.7KB system prompt. Not a config file anywhere. Ships with the binary, changes when Anthropic says so.
-
The ~370 feature flags. They live server-side; your local copy (
.claude.json) is a cache that re-syncs on their schedule. I found flags in mine for experiments I've never seen, promo banners, A/B copy tests, per-model "velvet hammer" variants (twenty-two of those, whatever they are), and two remote kill switches —tengu-off-switchandtengu-fable-off-switch— that Anthropic can flip and I cannot. - The title-generation side call. No setting. Every new session, a second model gets paid to name your conversation.
- The 40-call self-measurement burst. No setting. The context meter wants what it wants.
-
Your identity riding along. Account UUID, hashed device ID, session ID go in the API
metadataof every model call. OS, arch, node version, shell, package managers go in the telemetry. None of it optional.
The asymmetry is the story. The user's levers — a hook, some markdown files, one plugin, an env var — govern maybe 3% of the payload. The other 97% is decided by people you've never met, toggled by flags with names like tengu_amber_moleskin, shipped to you on every keystroke, and cached with a straight face.
The answer took 8.7 seconds. Here's where they went.
The response to my question was 127 tokens — 47 of them the model privately thinking "user's being blunt, keep it brief," and 80 tokens of actual answer.
Generating those 127 tokens takes well under a second. The other ~8 seconds? The model had to ingest 42,270 tokens of context first — and 13,445 of them weren't in the prompt cache yet, because this was the session's first message. I paid an eight-second cold-start tax so the model could re-read the operating manual for a browser I never launched.
The economics in one line: 42,270 tokens in, 127 tokens out. A 333:1 read-to-write ratio. To say hello.
It gets weirder
While answering me, the app quietly made a second, parallel model call — to a different, smaller model — whose entire job was to invent a title for the sidebar. Input: my rude question. Output: "Clarify Claude agent identity". Five hundred twenty-one tokens of prompt to produce four polite words I never asked for.
After the answer landed, the client fired 40 more API calls in one burst — all to a token-counting endpoint. Why 40? It was measuring itself: one call per slice of its own system prompt, plus one call per tool sending the string "foo" next to a single schema, so it could subtract the baseline and learn each tool's exact token weight. The app literally runs a scientific experiment on its own bloat, every session, to render a little context meter.
And the telemetry. Oh, the telemetry. In the same 15-second window: ~600KB across 184+ events, every one namespaced tengu_ — Anthropic's internal codename for Claude Code. tengu_feature_ok fired 72 times, once per remote feature-flag check. tengu_skill_loaded fired 48 times. The telemetry shipped to log my question outweighed the question by a factor of thirty thousand. (To be fair: I grepped every event — my actual words appear in none of them.)
Who configured this? Nobody. That's the point.
I went looking for the config file where I'd opted into all this. It doesn't exist. My settings contain a theme and one hook. My MCP server list is empty in every project. Every fat tool, every schema, every deferred-tool stub is switched on by ~370 server-side feature flags with names like tengu_velvet_hammer_opus_4_8 and tengu_amber_moleskin, cached to my disk and re-synced whenever the mothership pleases. There's even a complete 5KB onboarding-guide prompt template embedded inside the flag cache, sitting on my SSD in case a feature I've never used ever wants it.
There are two kill switches in that file: tengu-off-switch and tengu-fable-off-switch. Neither is mine to flip.
The uncomfortable defense
Here's the part that annoys me most: it's not even stupid. The 100KB of scaffolding is prompt-cached — I pay full prefill once per session, then it's cheap cache reads. The deferred-tool list I mocked exists precisely to avoid sending 60 more schemas. The 8.7 seconds is a one-time tax; turn two is fast. Every individual decision is defensible. The system is locally rational and globally deranged — a machine that ships a library with every postcard and has optimized the shipping.
But step back. A human answering "who are you" needs zero context refresh, no tool manifest, no telemetry burst, no second brain generating a title. We've built agents that must be handed their entire identity, capabilities, safety rules, and worldview from scratch on every request, because the underlying model remembers nothing. Statelessness is the original sin; everything else — the caching, the deferral, the 40-call self-measurement — is increasingly elaborate penance.
19 bytes in. 118,693 bytes of context, 600KB of telemetry, 43 API calls, two models, and 8.7 seconds later: "I'm Claude Code."
I know. I read the packet capture.
0 Comments
Log in to join the conversation.No comments yet. Be the first to share your thoughts.