

Take a look at the apps on your phone. Seriously, look at them. How many of them don’t require internet access? Not that many, right?
Nowadays, nearly every mobile application leverages internet connectivity in some form. Whether it’s fetching social media updates, syncing data, or streaming media; internet access is crucial. For developers, understanding and optimizing the network layer of an app is important for enhancing application performance and user experience.
Press enter or click to view image in full size
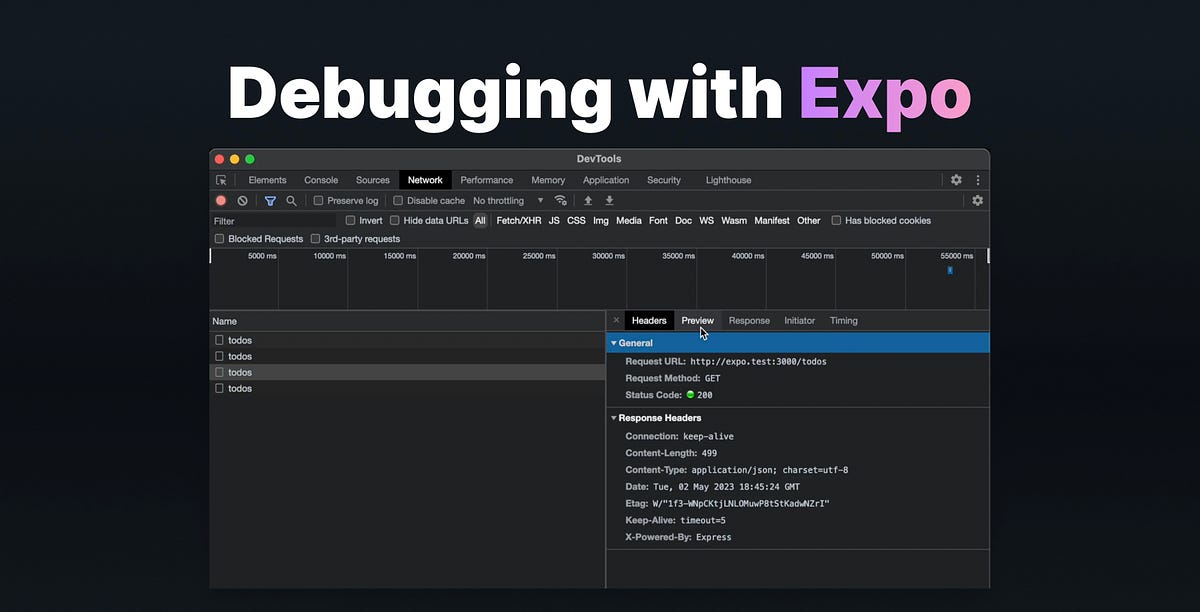
At Expo, we’ve created a network inspector to make it easier for you to debug network issues in your apps. In the tutorial video below you’ll see three unique things you can do with the network inspector:
- Inspect the response data of any API request
- Inspect the response size of any API request
- Inspect the request data
1. How to inspect the response data of any API request
Understanding the response data of an API is pivotal for ensuring data accuracy in your app. A frequent challenge for developers is data discrepancies, such as when an app doesn’t render expected values.
For example, while developing the Expo app, it became clear that the GitHub user data didn’t render the full name, even though the data is fetched properly. By using the network inspector to look into the response data on the “preview” tab, we could see that the data was available on another property.
Get Cedric van Putten’s stories in your inbox
Join Medium for free to get updates from this writer.
Remember me for faster sign in
What’s important to note here is that the network inspector lets you see the exact data returned by an API, which enables you to verify data integrity and rectify any discrepancies.
2. How to inspect the response size of any API request
Bandwidth is a precious resource. Oversized or unoptimized API responses can lead to slower app performance, affecting user experience. Developers should always ensure their app is downloading just the necessary amount of data, and no more.
In the tutorial’s example, images fetched from Unsplash were loading slow. Using the network inspector, we could see that the images loaded were unoptimized for its use case and caused a 28.2 MB download. By switching to smaller thumbnails, the initial download was reduced to a mere 147 KB. This improvement conserved data usage and made the app feel much more responsive.
Using the network inspector to regularly inspect the size of your API responses can help you identify inefficiencies and opportunities for optimization.
3. How to inspect the request data
Sometimes, the key to debugging lies in the request, not the response. Ensuring that an app sends the correct data in its requests is fundamental for proper functionality.
While swapping out the unoptimized images for the smallest images Unsplash offers, the quality of the images was noticeably degraded. With the network inspector, we could find a balance between size and quality just by trying out different image sizes and eventually landing on a good balance of size and quality of just 2.8 MB.
Inspecting request data can help you refine API calls, ensuring that they fetch the right data in the most efficient manner.
Press “J” in the terminal
These are just three little examples of ways that I often find myself using the network inspector to debug my apps. My hope is that you’re able to see how useful the insights are. By diving deep into the network layer, you can significantly enhance application performance and end user experience.
So, the next time you’re optimizing your app, don’t forget to press “J” in the terminal if you’re using Expo SDK 49 or higher!
P.S. If you’re interested in more debugging content, my colleague Keith Kurak recently published a tutorial about how to use ADB Logcat and macOS Console to debug applications.
0 Comments
Log in to join the conversation.No comments yet. Be the first to share your thoughts.